29
/
en
AIzaSyAYiBZKx7MnpbEhh9jyipgxe19OcubqV5w
April 1, 2024
75800
Azerbaijan
AZE
true
2
1
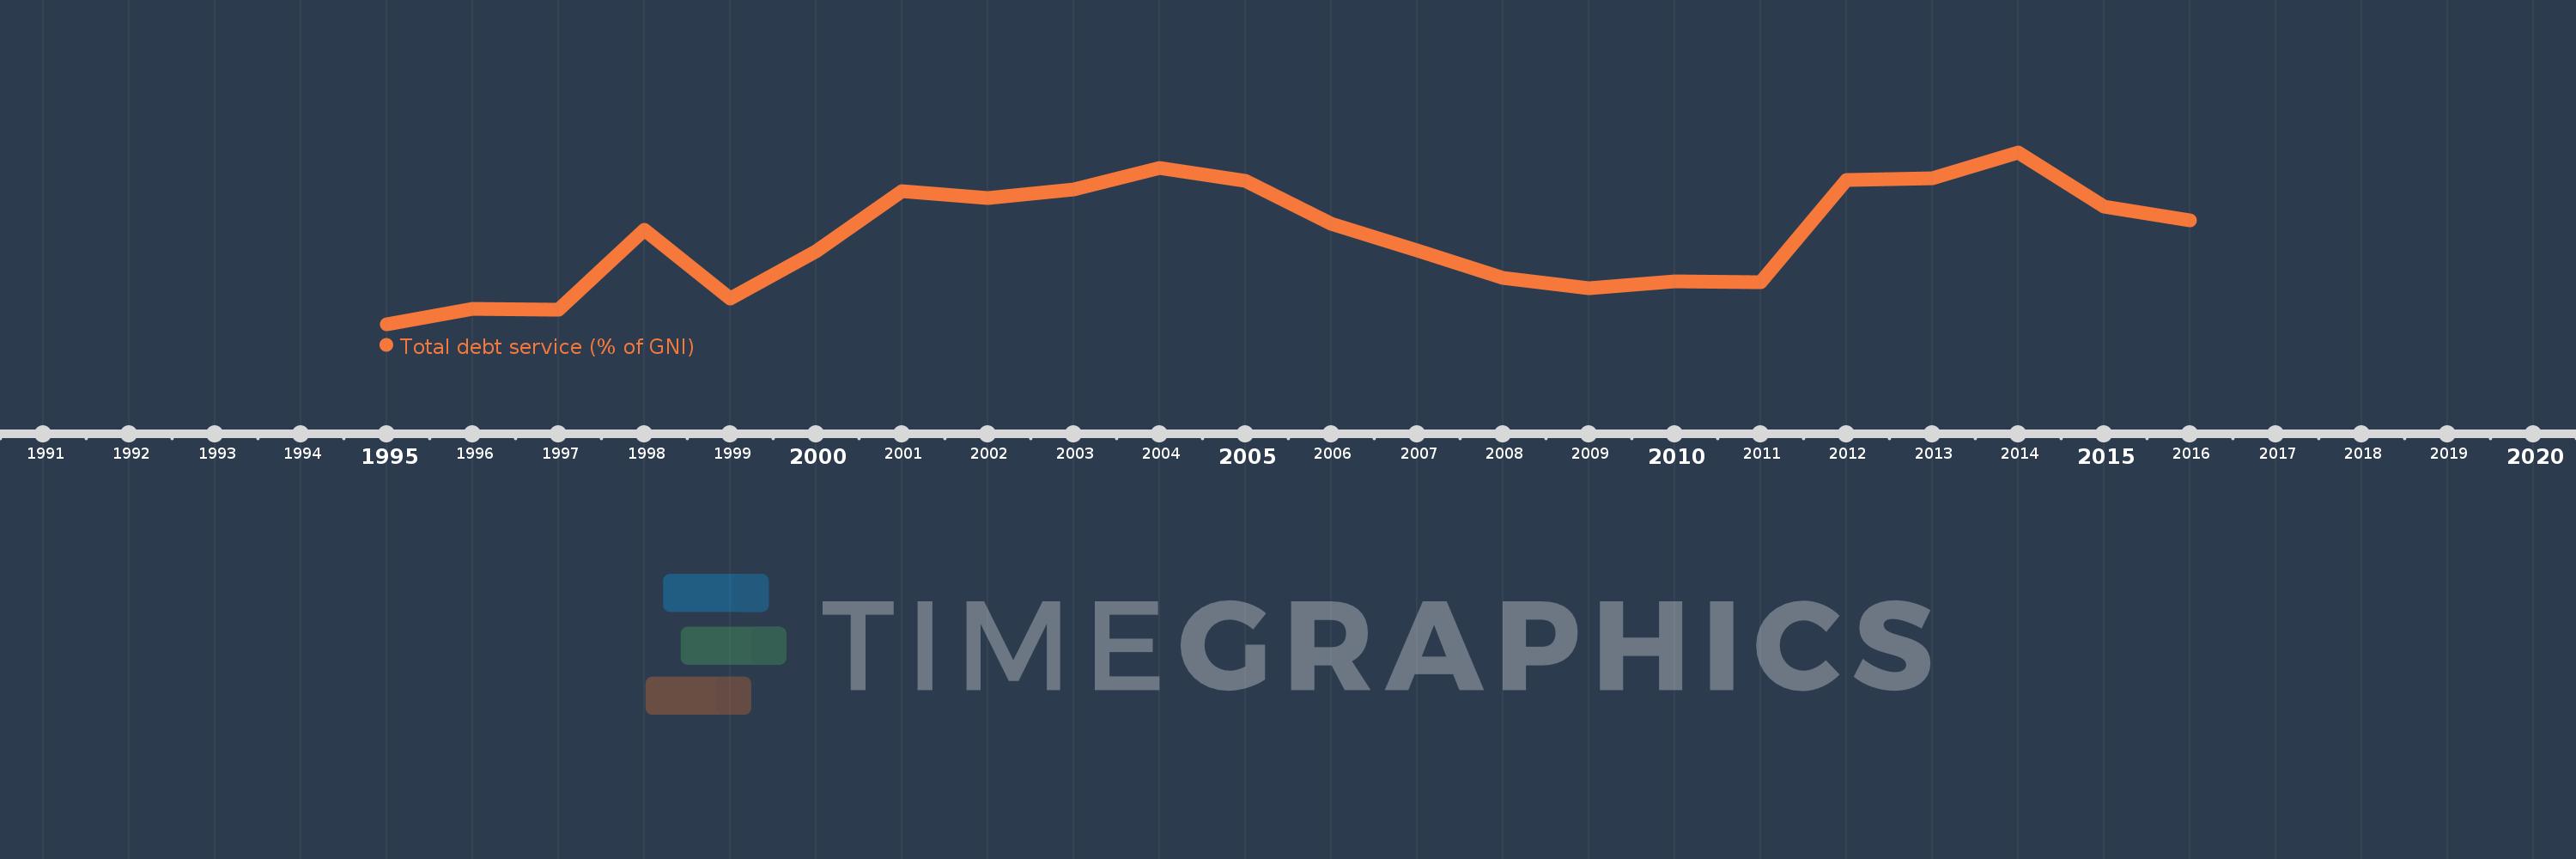
Total debt service (% of GNI)
2016,2015,2014,2013,2012,2011,2010,2009,2008,2007,2006,2005,2004,2003,2002,2001,2000,1999,1998,1997,1996,1995
This statistics in other country:
Timeline:
This timeline shows a graph from 1995 to 2016 of Azerbaijan. No data until 1994. Number of actual observations by date: 22.
Source name:
World Development Indicators
Source organization:
World Bank, International Debt Statistics.
Categories, topics:
Economy & Growth, External Debt
Last updated:
apr 23, 2017
Indicators value changes by year
At the date of observation
Value
Absolute change
Change from previous value
jan 1, 1995
0.011
+0.011
0.0%
jan 1, 1996
0.333
+0.323
3.05K%
jan 1, 1997
0.316
-0.017
-5.21%
jan 1, 1998
1.97
+1.654
523.23%
jan 1, 1999
0.538
-1.432
-72.68%
jan 1, 2000
1.511
+0.973
180.81%
jan 1, 2001
2.768
+1.257
83.21%
jan 1, 2002
2.617
-0.151
-5.46%
jan 1, 2003
2.796
+0.178
6.81%
jan 1, 2004
3.25
+0.454
16.25%
jan 1, 2005
2.978
-0.272
-8.36%
jan 1, 2006
2.09
-0.889
-29.84%
jan 1, 2007
1.54
-0.549
-26.28%
jan 1, 2008
0.965
-0.575
-37.33%
jan 1, 2009
0.762
-0.204
-21.08%
jan 1, 2010
0.897
+0.135
17.74%
jan 1, 2011
0.874
-0.023
-2.53%
jan 1, 2012
2.994
+2.12
242.47%
jan 1, 2013
3.027
+0.033
1.09%
jan 1, 2014
3.563
+0.536
17.69%
jan 1, 2015
2.451
-1.111
-31.19%
jan 1, 2016
2.159
-0.292
-11.93%
Ranking of countries by current statistics by years


Comments: