29
/
en
AIzaSyAYiBZKx7MnpbEhh9jyipgxe19OcubqV5w
April 1, 2024
268798
Tunisia
TUN
true
2
1
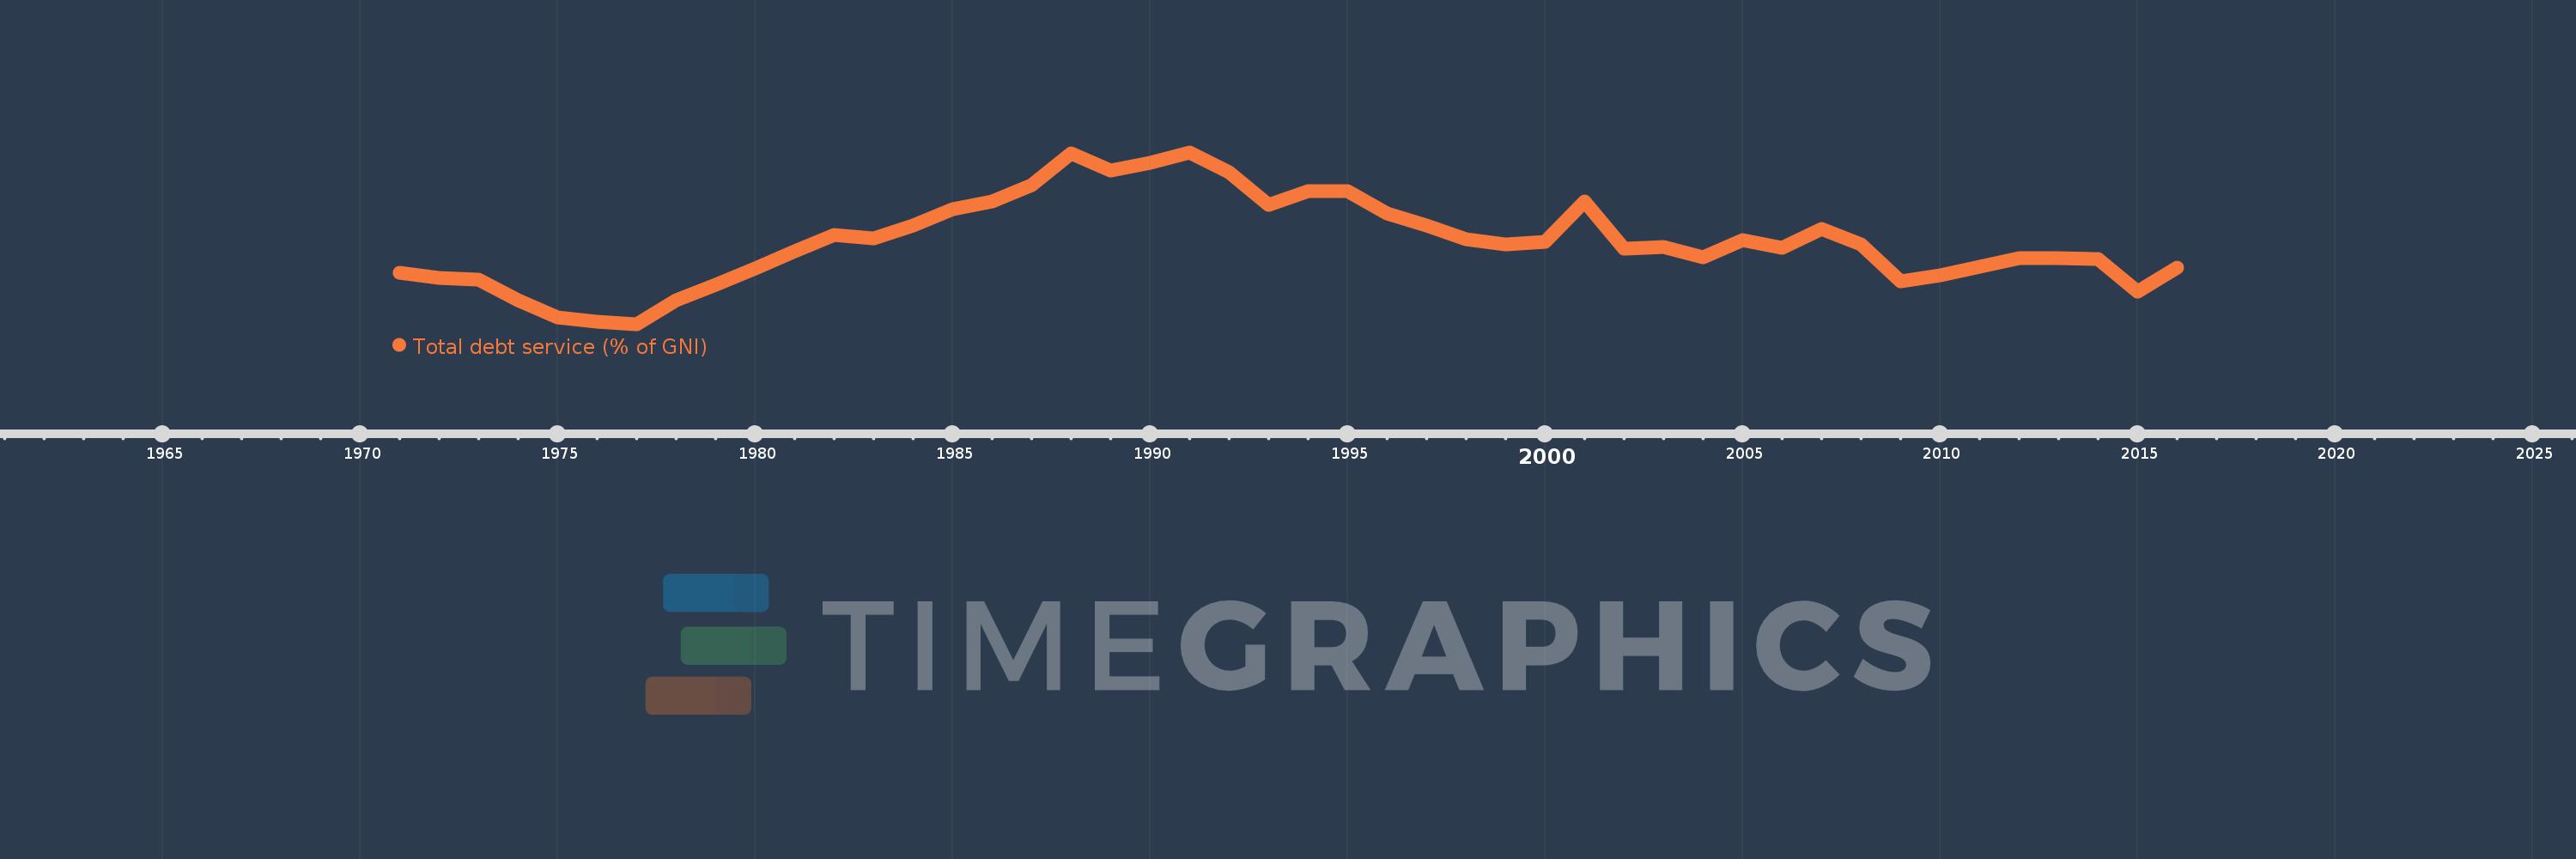
Total debt service (% of GNI)
2016,2015,2014,2013,2012,2011,2010,2009,2008,2007,2006,2005,2004,2003,2002,2001,2000,1999,1998,1997,1996,1995,1994,1993,1992,1991,1990,1989,1988,1987,1986,1985,1984,1983,1982,1981,1980,1979,1978,1977,1976,1975,1974,1973,1972,1971
This statistics in other country:
Timeline:
This timeline shows a graph from 1971 to 2016 of Tunisia. No data until 1970. Number of actual observations by date: 46.
Source name:
World Development Indicators
Source organization:
World Bank, International Debt Statistics.
Categories, topics:
Economy & Growth, External Debt
Last updated:
apr 23, 2017
Indicators value changes by year
Maximum:
12.047
jan 1, 1991
At the date of observation
Value
Absolute change
Change from previous value
jan 1, 1971
5.272
+5.272
0.0%
jan 1, 1972
4.981
-0.291
-5.52%
jan 1, 1973
4.849
-0.131
-2.64%
jan 1, 1974
3.702
-1.148
-23.67%
jan 1, 1975
2.733
-0.969
-26.17%
jan 1, 1976
2.468
-0.265
-9.71%
jan 1, 1977
2.348
-0.12
-4.86%
jan 1, 1978
3.711
+1.363
58.08%
jan 1, 1979
4.561
+0.85
22.9%
jan 1, 1980
5.507
+0.947
20.76%
jan 1, 1981
6.475
+0.967
17.56%
jan 1, 1982
7.407
+0.932
14.4%
jan 1, 1983
7.208
-0.199
-2.68%
jan 1, 1984
7.911
+0.703
9.75%
jan 1, 1985
8.837
+0.926
11.71%
jan 1, 1986
9.267
+0.43
4.86%
jan 1, 1987
10.206
+0.939
10.13%
jan 1, 1988
12.001
+1.796
17.6%
jan 1, 1989
11.025
-0.976
-8.14%
jan 1, 1990
11.436
+0.41
3.72%
jan 1, 1991
12.047
+0.611
5.34%
jan 1, 1992
10.942
-1.104
-9.17%
jan 1, 1993
9.084
-1.859
-16.99%
jan 1, 1994
9.882
+0.798
8.79%
jan 1, 1995
9.882
0.0
0.0%
jan 1, 1996
8.616
-1.265
-12.8%
jan 1, 1997
7.902
-0.715
-8.3%
jan 1, 1998
7.122
-0.779
-9.86%
jan 1, 1999
6.833
-0.289
-4.06%
jan 1, 2000
7.011
+0.178
2.61%
jan 1, 2001
9.3
+2.289
32.64%
jan 1, 2002
6.587
-2.713
-29.17%
jan 1, 2003
6.727
+0.14
2.12%
jan 1, 2004
6.149
-0.578
-8.59%
jan 1, 2005
7.108
+0.959
15.6%
jan 1, 2006
6.646
-0.462
-6.5%
jan 1, 2007
7.731
+1.085
16.33%
jan 1, 2008
6.834
-0.898
-11.61%
jan 1, 2009
4.771
-2.063
-30.19%
jan 1, 2010
5.099
+0.328
6.87%
jan 1, 2011
5.614
+0.515
10.1%
jan 1, 2012
6.09
+0.476
8.48%
jan 1, 2013
6.058
-0.032
-0.53%
jan 1, 2014
6.023
-0.034
-0.57%
jan 1, 2015
4.199
-1.825
-30.29%
jan 1, 2016
5.567
+1.368
32.59%
Ranking of countries by current statistics by years


Comments: