29
/
en
AIzaSyAYiBZKx7MnpbEhh9jyipgxe19OcubqV5w
April 1, 2024
148673
Guyana
GUY
true
2
1
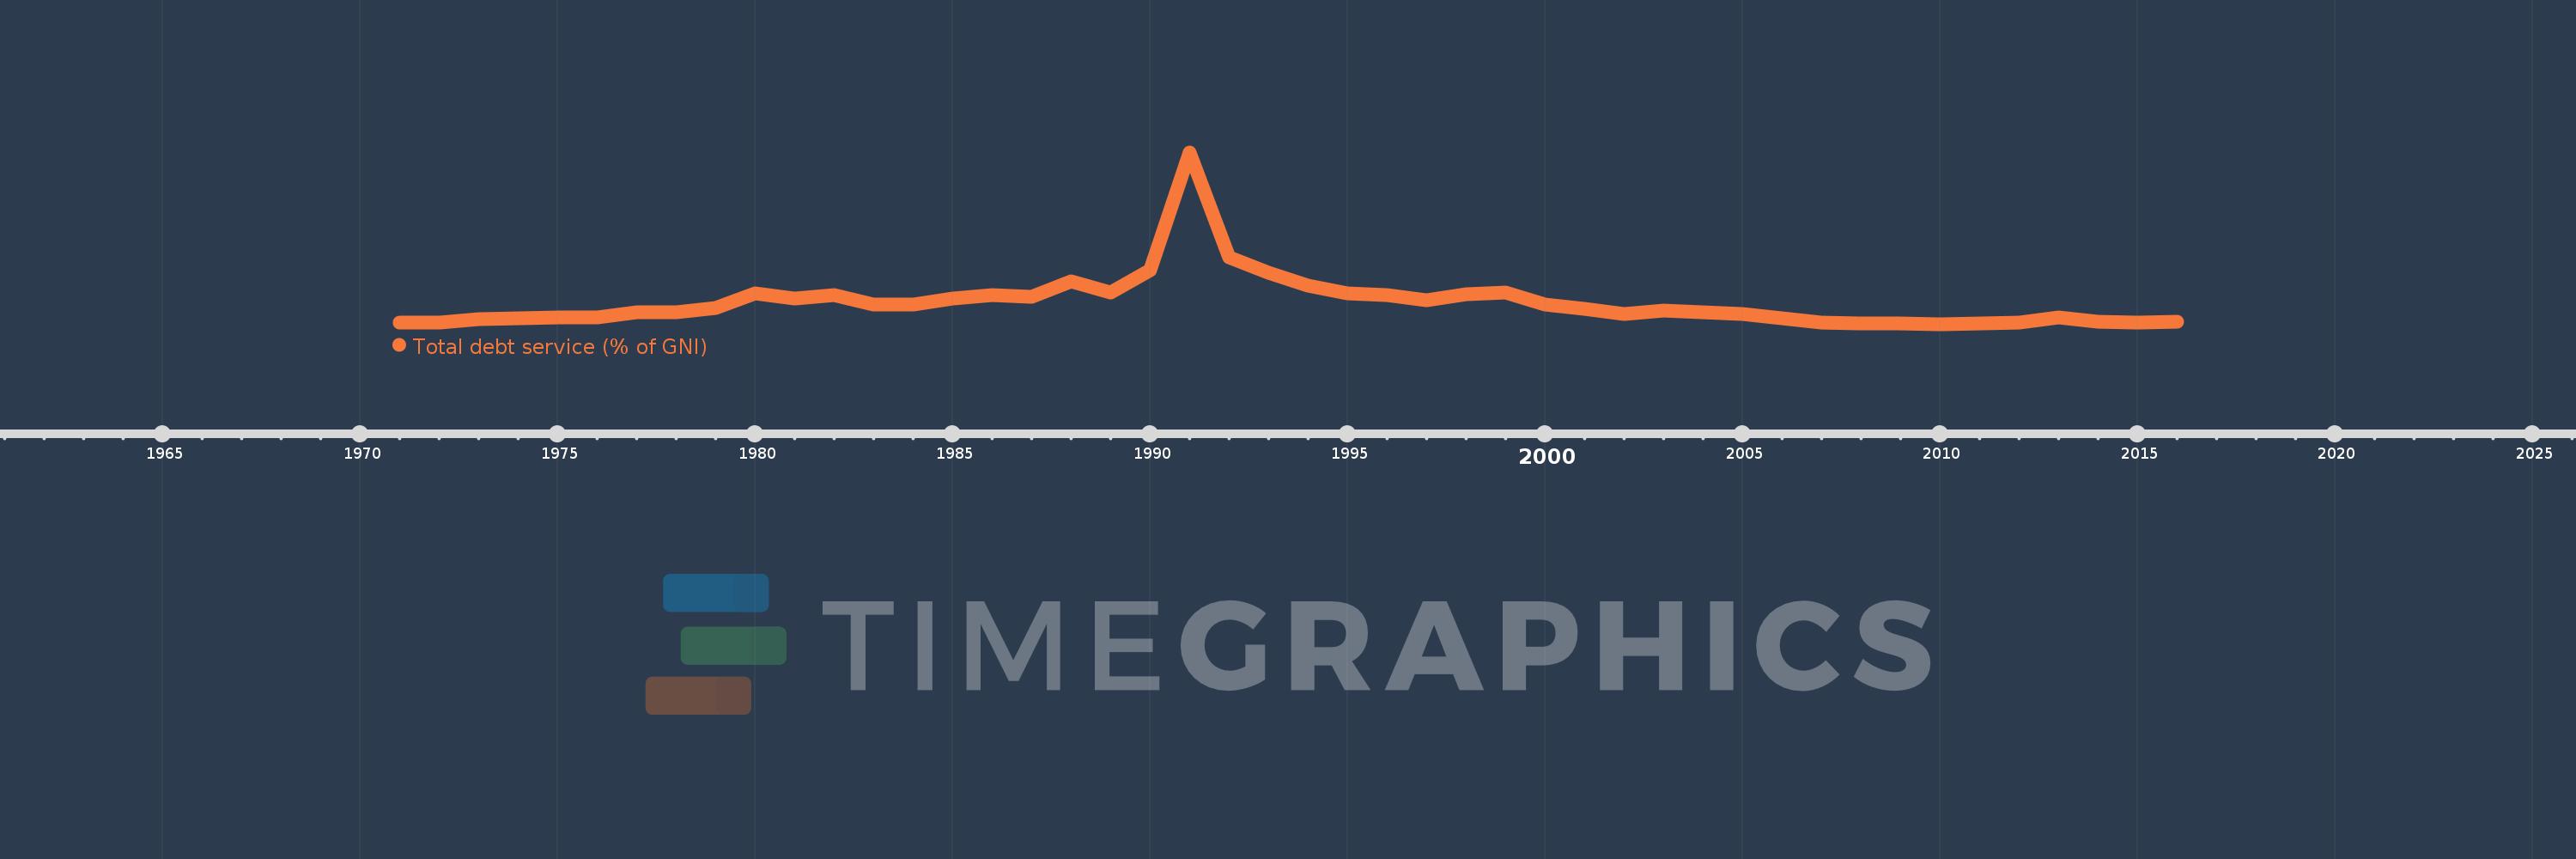
Total debt service (% of GNI)
2016,2015,2014,2013,2012,2011,2010,2009,2008,2007,2006,2005,2004,2003,2002,2001,2000,1999,1998,1997,1996,1995,1994,1993,1992,1991,1990,1989,1988,1987,1986,1985,1984,1983,1982,1981,1980,1979,1978,1977,1976,1975,1974,1973,1972,1971
This statistics in other country:
Timeline:
This timeline shows a graph from 1971 to 2016 of Guyana. No data until 1970. Number of actual observations by date: 46.
Source name:
World Development Indicators
Source organization:
World Bank, International Debt Statistics.
Categories, topics:
Economy & Growth, External Debt
Last updated:
apr 23, 2017
Indicators value changes by year
Maximum:
107.468
jan 1, 1991
At the date of observation
Value
Absolute change
Change from previous value
jan 1, 1971
2.284
+2.284
0.0%
jan 1, 1972
1.943
-0.34
-14.9%
jan 1, 1973
4.245
+2.302
118.44%
jan 1, 1974
4.543
+0.298
7.01%
jan 1, 1975
5.041
+0.499
10.98%
jan 1, 1976
4.954
-0.087
-1.73%
jan 1, 1977
8.241
+3.286
66.34%
jan 1, 1978
8.484
+0.244
2.96%
jan 1, 1979
11.077
+2.593
30.56%
jan 1, 1980
20.09
+9.013
81.36%
jan 1, 1981
16.946
-3.144
-15.65%
jan 1, 1982
19.278
+2.332
13.76%
jan 1, 1983
13.32
-5.958
-30.9%
jan 1, 1984
13.16
-0.16
-1.2%
jan 1, 1985
16.712
+3.552
26.99%
jan 1, 1986
19.042
+2.33
13.94%
jan 1, 1987
17.935
-1.108
-5.82%
jan 1, 1988
27.555
+9.62
53.64%
jan 1, 1989
20.792
-6.763
-24.54%
jan 1, 1990
34.525
+13.733
66.05%
jan 1, 1991
107.468
+72.943
211.27%
jan 1, 1992
42.647
-64.821
-60.32%
jan 1, 1993
32.697
-9.951
-23.33%
jan 1, 1994
24.715
-7.981
-24.41%
jan 1, 1995
20.212
-4.503
-18.22%
jan 1, 1996
19.248
-0.964
-4.77%
jan 1, 1997
16.032
-3.216
-16.71%
jan 1, 1998
19.333
+3.301
20.59%
jan 1, 1999
20.75
+1.417
7.33%
jan 1, 2000
13.292
-7.458
-35.94%
jan 1, 2001
10.595
-2.697
-20.29%
jan 1, 2002
7.18
-3.415
-32.23%
jan 1, 2003
9.693
+2.513
35.0%
jan 1, 2004
8.398
-1.295
-13.36%
jan 1, 2005
7.136
-1.262
-15.03%
jan 1, 2006
4.493
-2.643
-37.04%
jan 1, 2007
2.276
-2.217
-49.33%
jan 1, 2008
1.651
-0.625
-27.45%
jan 1, 2009
1.407
-0.244
-14.78%
jan 1, 2010
1.01
-0.398
-28.25%
jan 1, 2011
1.392
+0.382
37.85%
jan 1, 2012
1.778
+0.386
27.71%
jan 1, 2013
5.296
+3.519
197.94%
jan 1, 2014
2.585
-2.711
-51.19%
jan 1, 2015
2.154
-0.431
-16.66%
jan 1, 2016
2.769
+0.615
28.53%
Ranking of countries by current statistics by years


Comments: