29
/
en
AIzaSyAYiBZKx7MnpbEhh9jyipgxe19OcubqV5w
April 1, 2024
26968
Early-demographic dividend
EAR
false
2
1
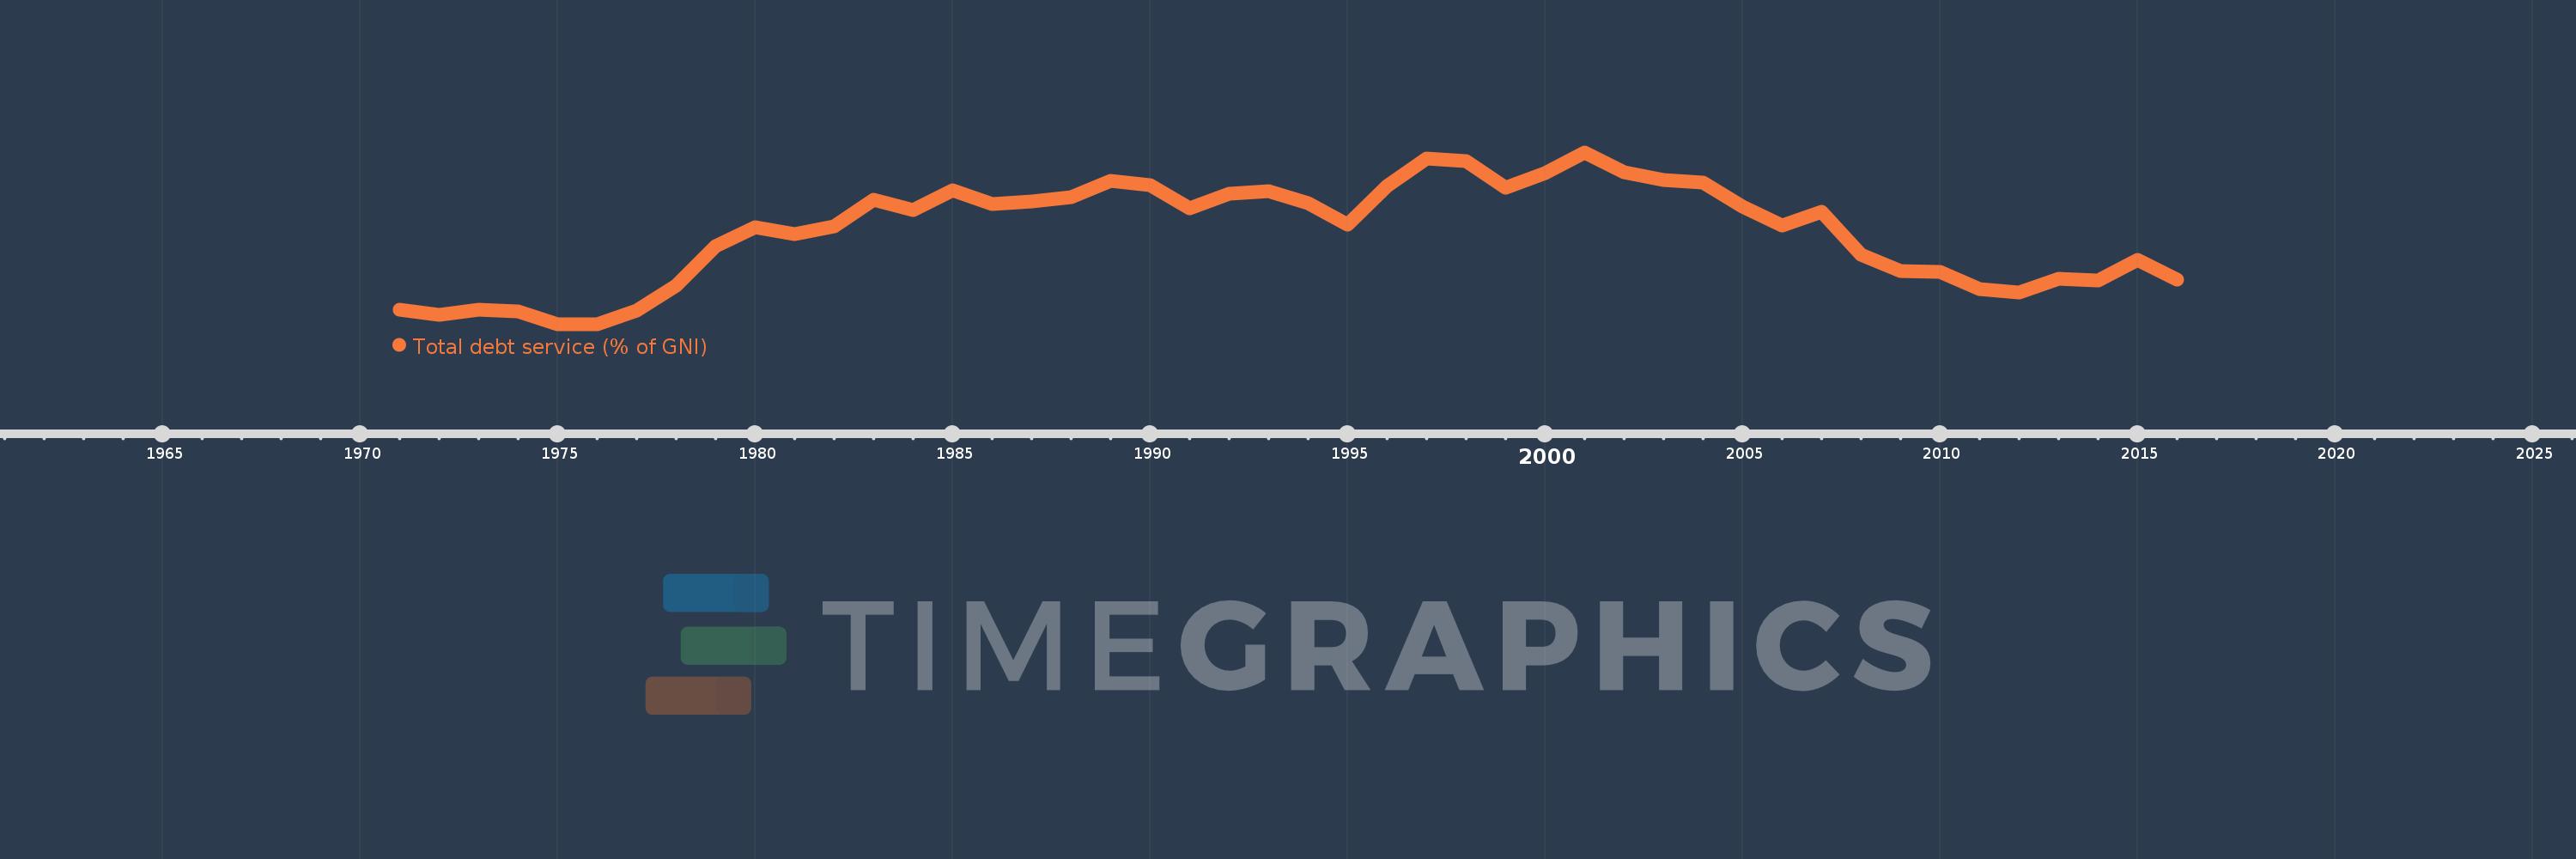
Total debt service (% of GNI)
2016,2015,2014,2013,2012,2011,2010,2009,2008,2007,2006,2005,2004,2003,2002,2001,2000,1999,1998,1997,1996,1995,1994,1993,1992,1991,1990,1989,1988,1987,1986,1985,1984,1983,1982,1981,1980,1979,1978,1977,1976,1975,1974,1973,1972,1971
This statistics in other country:
Timeline:
This timeline shows a graph from 1971 to 2016 of Early-demographic dividend. No data until 1970. Number of actual observations by date: 46.
Source name:
World Development Indicators
Source organization:
World Bank, International Debt Statistics.
Categories, topics:
Economy & Growth, External Debt
Last updated:
apr 23, 2017
Indicators value changes by year
At the date of observation
Value
Absolute change
Change from previous value
jan 1, 1971
2.582
+2.582
0.0%
jan 1, 1972
2.461
-0.121
-4.68%
jan 1, 1973
2.563
+0.102
4.15%
jan 1, 1974
2.536
-0.028
-1.08%
jan 1, 1975
2.237
-0.299
-11.79%
jan 1, 1976
2.239
+0.002
0.09%
jan 1, 1977
2.552
+0.313
13.98%
jan 1, 1978
3.121
+0.569
22.3%
jan 1, 1979
4.04
+0.919
29.44%
jan 1, 1980
4.483
+0.444
10.98%
jan 1, 1981
4.312
-0.171
-3.82%
jan 1, 1982
4.505
+0.193
4.48%
jan 1, 1983
5.121
+0.615
13.66%
jan 1, 1984
4.867
-0.253
-4.94%
jan 1, 1985
5.333
+0.466
9.57%
jan 1, 1986
5.006
-0.327
-6.13%
jan 1, 1987
5.082
+0.076
1.51%
jan 1, 1988
5.165
+0.082
1.62%
jan 1, 1989
5.543
+0.378
7.33%
jan 1, 1990
5.45
-0.092
-1.67%
jan 1, 1991
4.913
-0.538
-9.86%
jan 1, 1992
5.252
+0.339
6.89%
jan 1, 1993
5.323
+0.072
1.37%
jan 1, 1994
5.043
-0.281
-5.27%
jan 1, 1995
4.532
-0.511
-10.13%
jan 1, 1996
5.426
+0.894
19.72%
jan 1, 1997
6.062
+0.636
11.72%
jan 1, 1998
6.001
-0.061
-1.0%
jan 1, 1999
5.4
-0.601
-10.01%
jan 1, 2000
5.728
+0.328
6.07%
jan 1, 2001
6.209
+0.481
8.4%
jan 1, 2002
5.751
-0.458
-7.37%
jan 1, 2003
5.575
-0.177
-3.07%
jan 1, 2004
5.505
-0.07
-1.25%
jan 1, 2005
4.959
-0.547
-9.93%
jan 1, 2006
4.525
-0.434
-8.75%
jan 1, 2007
4.839
+0.314
6.94%
jan 1, 2008
3.846
-0.993
-20.51%
jan 1, 2009
3.475
-0.372
-9.66%
jan 1, 2010
3.451
-0.023
-0.68%
jan 1, 2011
3.054
-0.397
-11.5%
jan 1, 2012
2.965
-0.09
-2.94%
jan 1, 2013
3.286
+0.321
10.84%
jan 1, 2014
3.251
-0.035
-1.07%
jan 1, 2015
3.727
+0.477
14.66%
jan 1, 2016
3.258
-0.469
-12.59%
Ranking of countries by current statistics by years


Comments: