29
/
en
AIzaSyAYiBZKx7MnpbEhh9jyipgxe19OcubqV5w
April 1, 2024
47804
Lower middle income
LMC
false
2
1
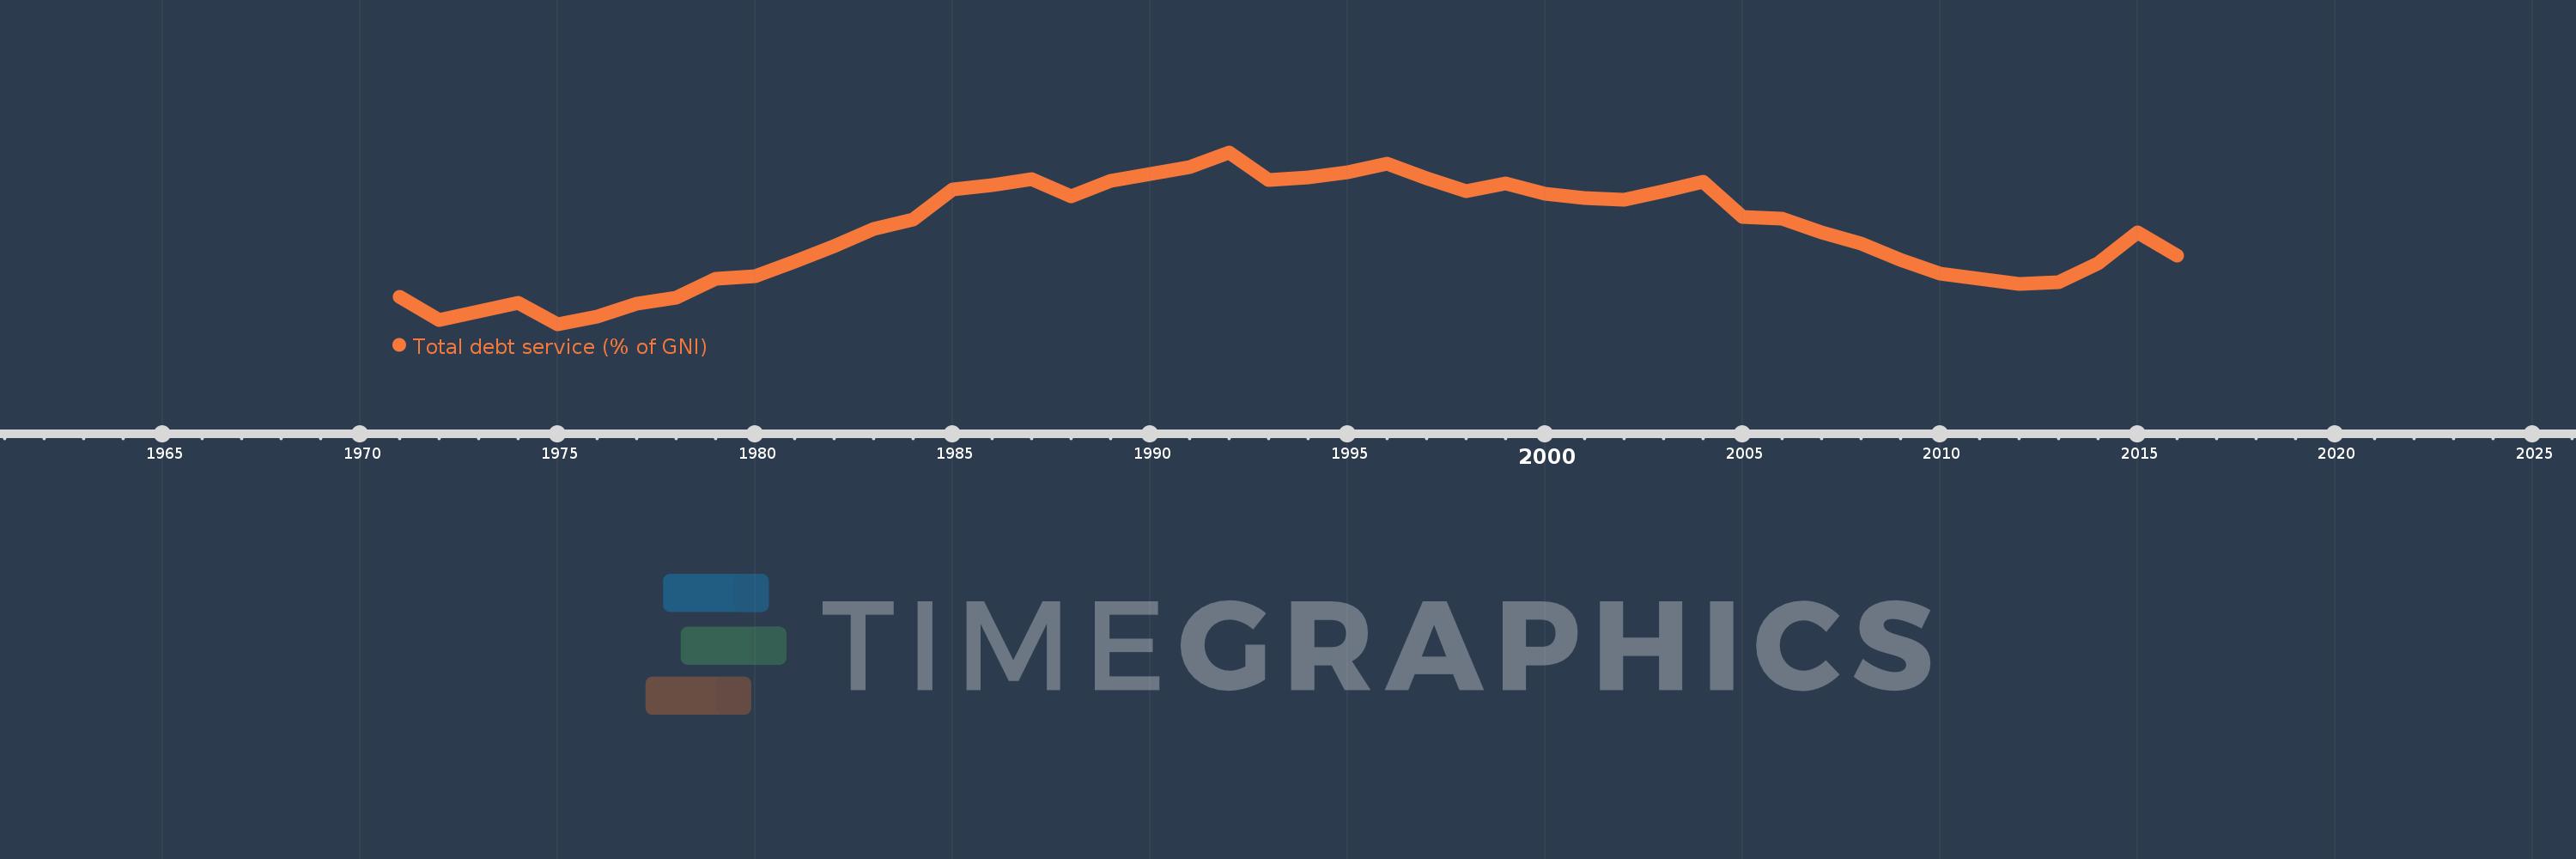
Total debt service (% of GNI)
2016,2015,2014,2013,2012,2011,2010,2009,2008,2007,2006,2005,2004,2003,2002,2001,2000,1999,1998,1997,1996,1995,1994,1993,1992,1991,1990,1989,1988,1987,1986,1985,1984,1983,1982,1981,1980,1979,1978,1977,1976,1975,1974,1973,1972,1971
This statistics in other country:
Timeline:
This timeline shows a graph from 1971 to 2016 of Lower middle income. No data until 1970. Number of actual observations by date: 46.
Source name:
World Development Indicators
Source organization:
World Bank, International Debt Statistics.
Categories, topics:
Economy & Growth, External Debt
Last updated:
apr 23, 2017
Indicators value changes by year
At the date of observation
Value
Absolute change
Change from previous value
jan 1, 1971
2.351
+2.351
0.0%
jan 1, 1972
1.797
-0.554
-23.55%
jan 1, 1973
2.01
+0.213
11.87%
jan 1, 1974
2.212
+0.201
10.01%
jan 1, 1975
1.707
-0.504
-22.81%
jan 1, 1976
1.888
+0.181
10.57%
jan 1, 1977
2.181
+0.293
15.55%
jan 1, 1978
2.326
+0.145
6.66%
jan 1, 1979
2.77
+0.444
19.07%
jan 1, 1980
2.824
+0.053
1.93%
jan 1, 1981
3.169
+0.346
12.25%
jan 1, 1982
3.525
+0.356
11.23%
jan 1, 1983
3.926
+0.401
11.38%
jan 1, 1984
4.128
+0.202
5.15%
jan 1, 1985
4.842
+0.714
17.29%
jan 1, 1986
4.941
+0.099
2.04%
jan 1, 1987
5.063
+0.122
2.48%
jan 1, 1988
4.667
-0.396
-7.83%
jan 1, 1989
5.031
+0.364
7.81%
jan 1, 1990
5.188
+0.157
3.13%
jan 1, 1991
5.347
+0.158
3.05%
jan 1, 1992
5.691
+0.345
6.45%
jan 1, 1993
5.052
-0.639
-11.23%
jan 1, 1994
5.105
+0.053
1.05%
jan 1, 1995
5.232
+0.127
2.48%
jan 1, 1996
5.426
+0.194
3.7%
jan 1, 1997
5.099
-0.326
-6.02%
jan 1, 1998
4.783
-0.316
-6.2%
jan 1, 1999
4.979
+0.196
4.1%
jan 1, 2000
4.723
-0.256
-5.15%
jan 1, 2001
4.628
-0.094
-1.99%
jan 1, 2002
4.595
-0.034
-0.73%
jan 1, 2003
4.793
+0.198
4.31%
jan 1, 2004
5.017
+0.224
4.67%
jan 1, 2005
4.195
-0.822
-16.38%
jan 1, 2006
4.161
-0.034
-0.81%
jan 1, 2007
3.827
-0.334
-8.02%
jan 1, 2008
3.576
-0.251
-6.56%
jan 1, 2009
3.201
-0.375
-10.5%
jan 1, 2010
2.888
-0.312
-9.75%
jan 1, 2011
2.761
-0.127
-4.41%
jan 1, 2012
2.646
-0.115
-4.18%
jan 1, 2013
2.679
+0.033
1.26%
jan 1, 2014
3.119
+0.439
16.4%
jan 1, 2015
3.833
+0.714
22.9%
jan 1, 2016
3.296
-0.537
-14.01%
Ranking of countries by current statistics by years


Comments: