29
/
en
AIzaSyAYiBZKx7MnpbEhh9jyipgxe19OcubqV5w
April 1, 2024
110443
Congo, Dem. Rep.
COD
true
2
1
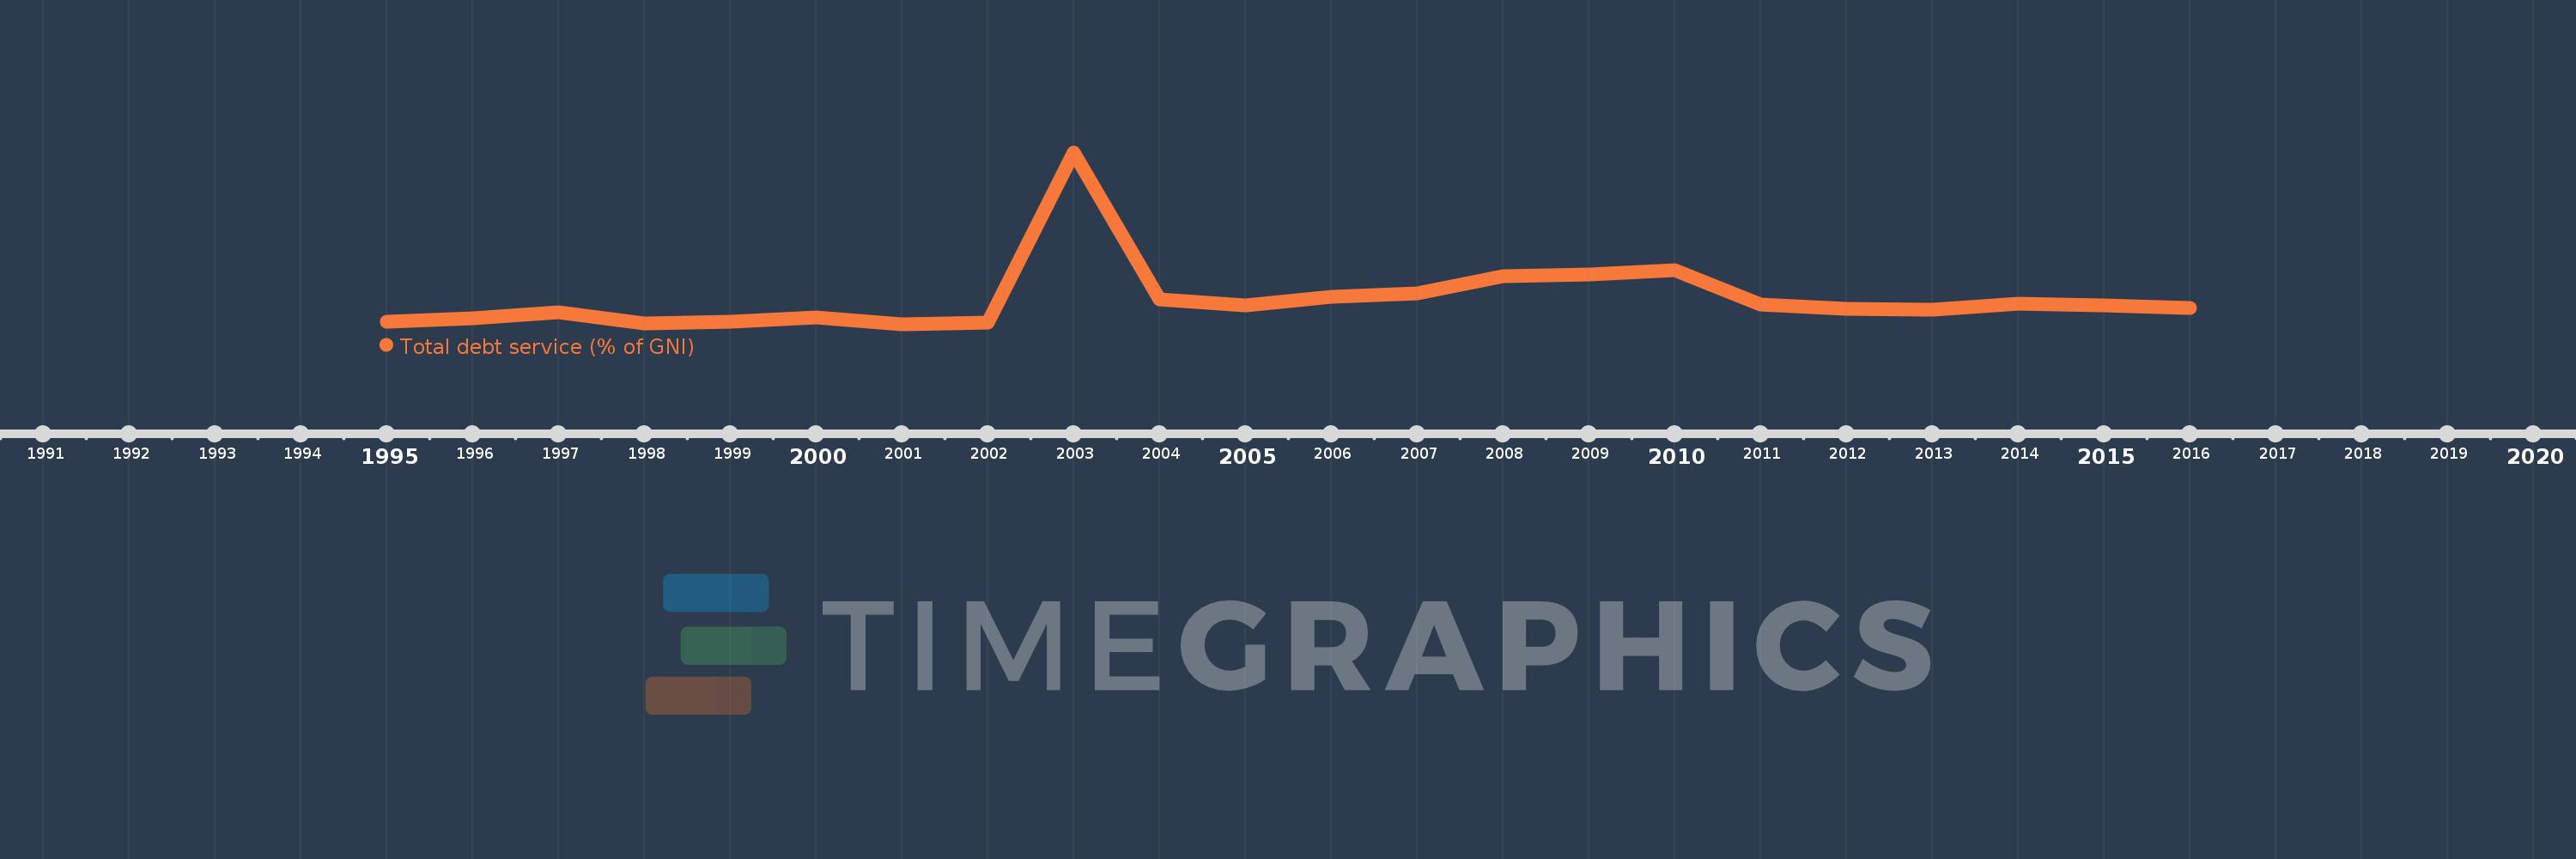
Total debt service (% of GNI)
2016,2015,2014,2013,2012,2011,2010,2009,2008,2007,2006,2005,2004,2003,2002,2001,2000,1999,1998,1997,1996,1995
This statistics in other country:
Timeline:
This timeline shows a graph from 1995 to 2016 of Congo, Dem. Rep.. No data until 1994. Number of actual observations by date: 22.
Source name:
World Development Indicators
Source organization:
World Bank, International Debt Statistics.
Categories, topics:
Economy & Growth, External Debt
Last updated:
apr 23, 2017
Indicators value changes by year
Maximum:
11.019
jan 1, 2003
At the date of observation
Value
Absolute change
Change from previous value
jan 1, 1995
0.305
+0.305
0.0%
jan 1, 1996
0.512
+0.207
67.9%
jan 1, 1997
0.897
+0.385
75.29%
jan 1, 1998
0.22
-0.676
-75.44%
jan 1, 1999
0.332
+0.112
50.77%
jan 1, 2000
0.586
+0.254
76.54%
jan 1, 2001
0.159
-0.427
-72.86%
jan 1, 2002
0.286
+0.127
79.99%
jan 1, 2003
11.019
+10.733
3.75K%
jan 1, 2004
1.702
-9.317
-84.56%
jan 1, 2005
1.337
-0.365
-21.44%
jan 1, 2006
1.902
+0.565
42.29%
jan 1, 2007
2.096
+0.194
10.18%
jan 1, 2008
3.186
+1.09
52.03%
jan 1, 2009
3.317
+0.13
4.09%
jan 1, 2010
3.577
+0.26
7.85%
jan 1, 2011
1.402
-2.175
-60.8%
jan 1, 2012
1.137
-0.265
-18.93%
jan 1, 2013
1.079
-0.058
-5.08%
jan 1, 2014
1.473
+0.394
36.53%
jan 1, 2015
1.372
-0.101
-6.86%
jan 1, 2016
1.2
-0.172
-12.51%
Ranking of countries by current statistics by years


Comments: