29
/
en
AIzaSyAYiBZKx7MnpbEhh9jyipgxe19OcubqV5w
April 1, 2024
246398
South Africa
ZAF
true
2
1
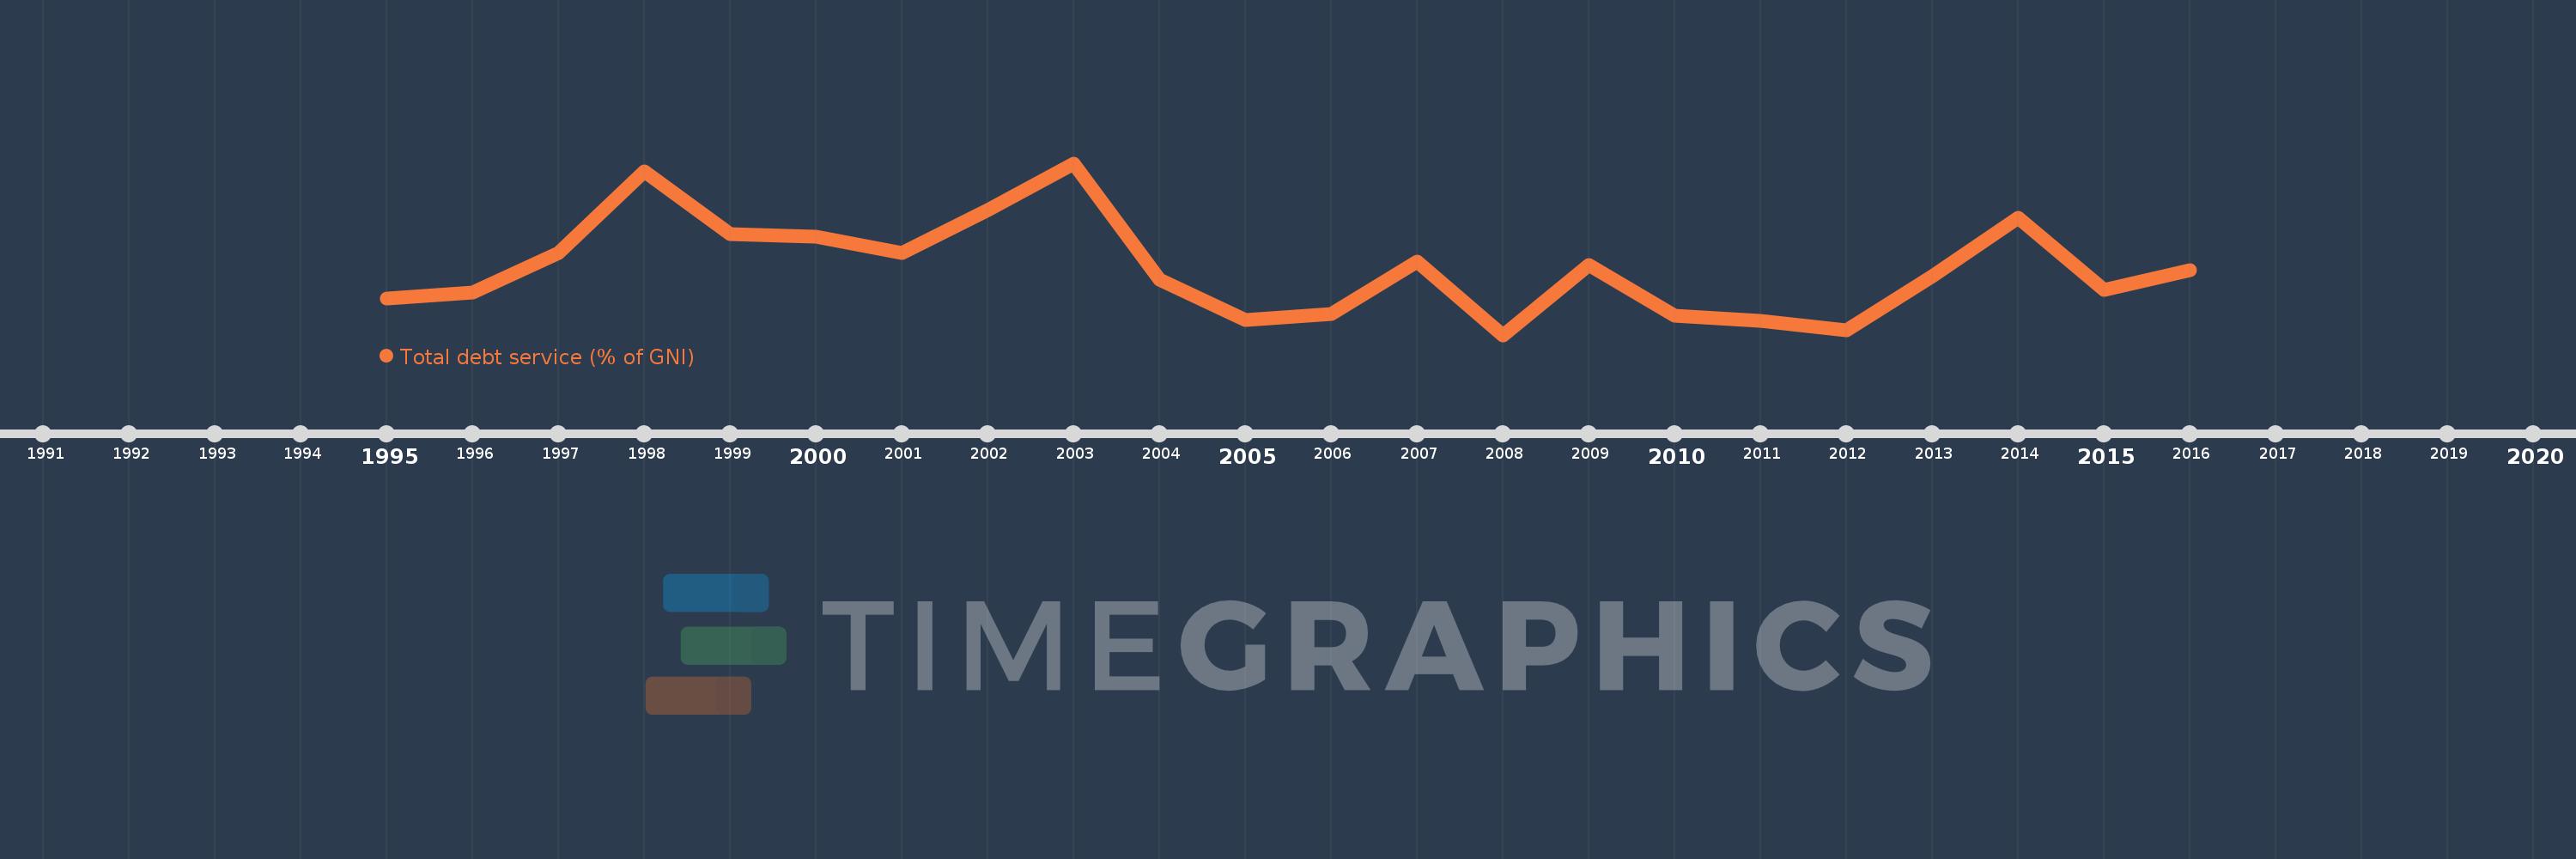
Total debt service (% of GNI)
2016,2015,2014,2013,2012,2011,2010,2009,2008,2007,2006,2005,2004,2003,2002,2001,2000,1999,1998,1997,1996,1995
This statistics in other country:
Timeline:
This timeline shows a graph from 1995 to 2016 of South Africa. No data until 1994. Number of actual observations by date: 22.
Source name:
World Development Indicators
Source organization:
World Bank, International Debt Statistics.
Categories, topics:
Economy & Growth, External Debt
Last updated:
apr 23, 2017
Indicators value changes by year
At the date of observation
Value
Absolute change
Change from previous value
jan 1, 1995
2.113
+2.113
0.0%
jan 1, 1996
2.222
+0.109
5.18%
jan 1, 1997
2.932
+0.71
31.94%
jan 1, 1998
4.38
+1.448
49.38%
jan 1, 1999
3.261
-1.118
-25.53%
jan 1, 2000
3.226
-0.035
-1.07%
jan 1, 2001
2.927
-0.299
-9.28%
jan 1, 2002
3.703
+0.776
26.5%
jan 1, 2003
4.53
+0.827
22.33%
jan 1, 2004
2.459
-2.07
-45.71%
jan 1, 2005
1.743
-0.716
-29.12%
jan 1, 2006
1.846
+0.103
5.9%
jan 1, 2007
2.778
+0.932
50.49%
jan 1, 2008
1.468
-1.31
-47.15%
jan 1, 2009
2.721
+1.253
85.33%
jan 1, 2010
1.805
-0.916
-33.65%
jan 1, 2011
1.728
-0.077
-4.29%
jan 1, 2012
1.551
-0.177
-10.26%
jan 1, 2013
2.524
+0.973
62.76%
jan 1, 2014
3.562
+1.038
41.14%
jan 1, 2015
2.279
-1.284
-36.04%
jan 1, 2016
2.622
+0.343
15.07%
Ranking of countries by current statistics by years


Comments: