29
/
en
AIzaSyAYiBZKx7MnpbEhh9jyipgxe19OcubqV5w
April 1, 2024
220316
Papua New Guinea
PNG
true
2
1
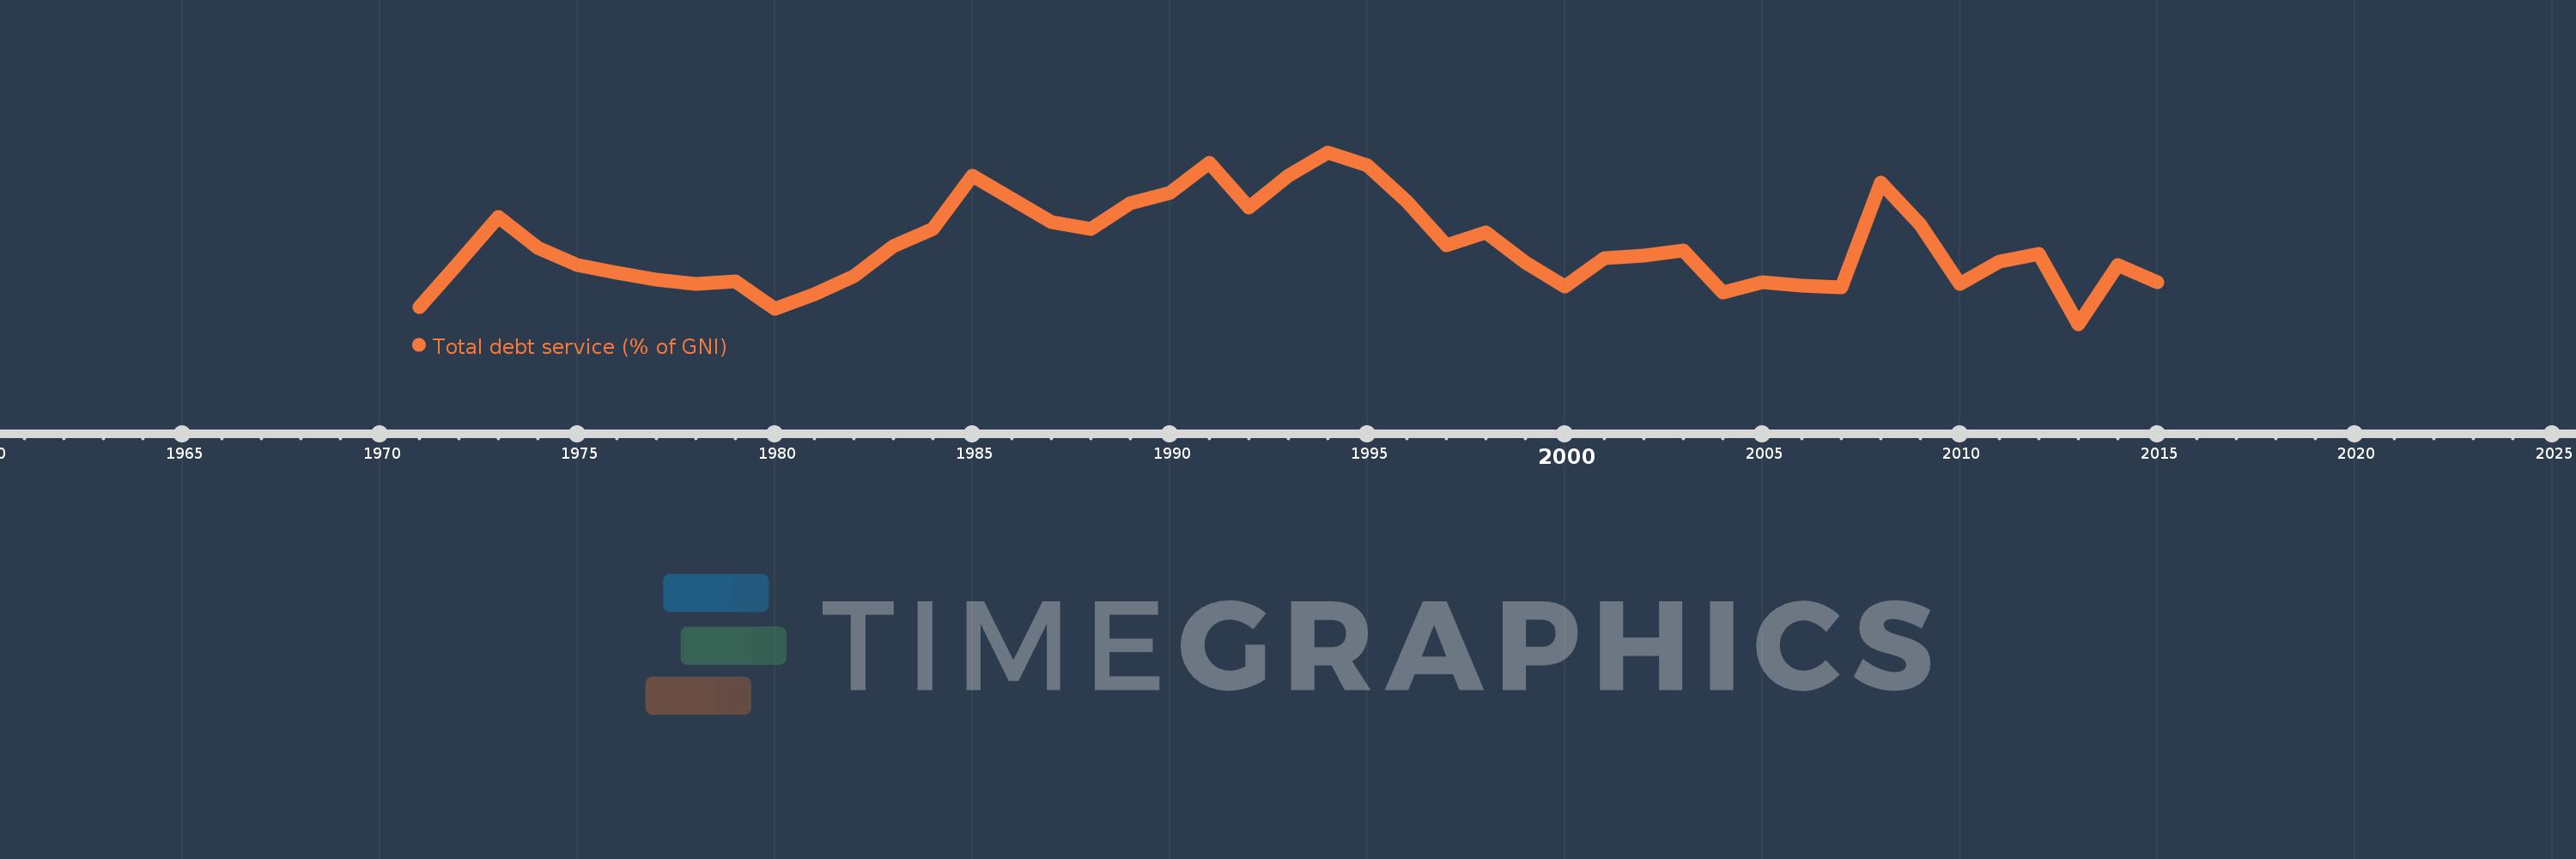
Total debt service (% of GNI)
2015,2014,2013,2012,2011,2010,2009,2008,2007,2006,2005,2004,2003,2002,2001,2000,1999,1998,1997,1996,1995,1994,1993,1992,1991,1990,1989,1988,1987,1986,1985,1984,1983,1982,1981,1980,1979,1978,1977,1976,1975,1974,1973,1972,1971
This statistics in other country:
Timeline:
This timeline shows a graph from 1971 to 2015 of Papua New Guinea. No data until 1970. Number of actual observations by date: 45.
Source name:
World Development Indicators
Source organization:
World Bank, International Debt Statistics.
Categories, topics:
Economy & Growth, External Debt
Last updated:
apr 23, 2017
Indicators value changes by year
Maximum:
18.763
jan 1, 1994
At the date of observation
Value
Absolute change
Change from previous value
jan 1, 1971
4.819
+4.819
0.0%
jan 1, 1972
8.892
+4.073
84.52%
jan 1, 1973
12.925
+4.033
45.35%
jan 1, 1974
10.206
-2.719
-21.04%
jan 1, 1975
8.597
-1.609
-15.76%
jan 1, 1976
7.916
-0.681
-7.92%
jan 1, 1977
7.28
-0.637
-8.04%
jan 1, 1978
6.914
-0.366
-5.03%
jan 1, 1979
7.192
+0.279
4.03%
jan 1, 1980
4.698
-2.494
-34.68%
jan 1, 1981
6.025
+1.327
28.24%
jan 1, 1982
7.648
+1.623
26.94%
jan 1, 1983
10.345
+2.697
35.26%
jan 1, 1984
11.851
+1.506
14.56%
jan 1, 1985
16.689
+4.839
40.83%
jan 1, 1986
14.561
-2.128
-12.75%
jan 1, 1987
12.506
-2.055
-14.12%
jan 1, 1988
11.85
-0.655
-5.24%
jan 1, 1989
14.171
+2.321
19.59%
jan 1, 1990
15.112
+0.941
6.64%
jan 1, 1991
17.862
+2.75
18.19%
jan 1, 1992
13.773
-4.089
-22.89%
jan 1, 1993
16.655
+2.882
20.92%
jan 1, 1994
18.763
+2.108
12.65%
jan 1, 1995
17.602
-1.161
-6.19%
jan 1, 1996
14.331
-3.271
-18.58%
jan 1, 1997
10.423
-3.908
-27.27%
jan 1, 1998
11.529
+1.106
10.61%
jan 1, 1999
8.847
-2.682
-23.26%
jan 1, 2000
6.653
-2.194
-24.79%
jan 1, 2001
9.235
+2.582
38.81%
jan 1, 2002
9.502
+0.266
2.88%
jan 1, 2003
9.963
+0.462
4.86%
jan 1, 2004
6.114
-3.849
-38.64%
jan 1, 2005
7.072
+0.958
15.67%
jan 1, 2006
6.798
-0.274
-3.88%
jan 1, 2007
6.609
-0.189
-2.78%
jan 1, 2008
16.069
+9.459
143.12%
jan 1, 2009
12.278
-3.791
-23.59%
jan 1, 2010
6.897
-5.381
-43.83%
jan 1, 2011
8.896
+2.0
29.0%
jan 1, 2012
9.608
+0.712
8.0%
jan 1, 2013
3.295
-6.314
-65.71%
jan 1, 2014
8.616
+5.322
161.53%
jan 1, 2015
7.05
-1.566
-18.17%
Ranking of countries by current statistics by years


Comments: