29
/
en
AIzaSyAYiBZKx7MnpbEhh9jyipgxe19OcubqV5w
April 1, 2024
265373
Togo
TGO
true
2
1
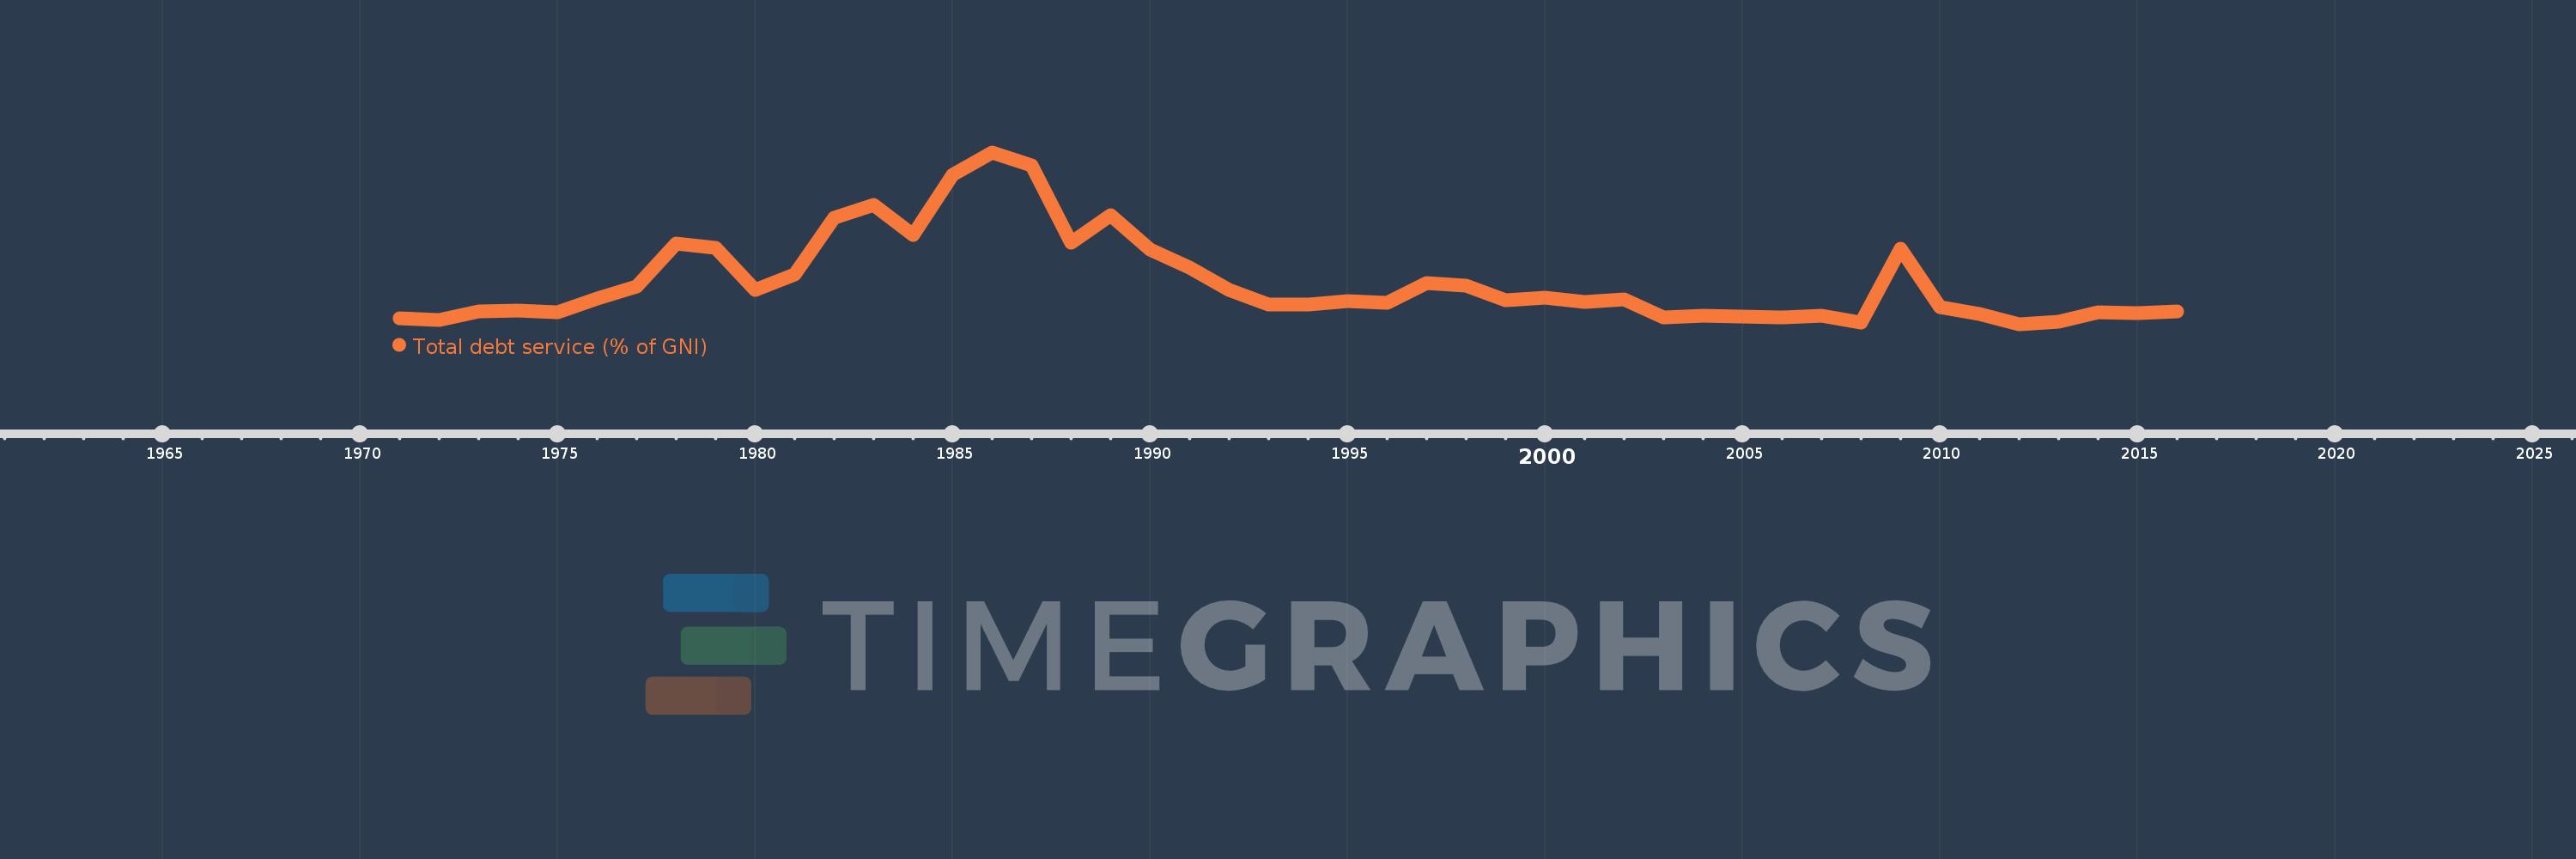
Total debt service (% of GNI)
2016,2015,2014,2013,2012,2011,2010,2009,2008,2007,2006,2005,2004,2003,2002,2001,2000,1999,1998,1997,1996,1995,1994,1993,1992,1991,1990,1989,1988,1987,1986,1985,1984,1983,1982,1981,1980,1979,1978,1977,1976,1975,1974,1973,1972,1971
This statistics in other country:
Timeline:
This timeline shows a graph from 1971 to 2016 of Togo. No data until 1970. Number of actual observations by date: 46.
Source name:
World Development Indicators
Source organization:
World Bank, International Debt Statistics.
Categories, topics:
Economy & Growth, External Debt
Last updated:
apr 23, 2017
Indicators value changes by year
Maximum:
15.342
jan 1, 1986
At the date of observation
Value
Absolute change
Change from previous value
jan 1, 1971
0.948
+0.948
0.0%
jan 1, 1972
0.858
-0.09
-9.49%
jan 1, 1973
1.61
+0.752
87.71%
jan 1, 1974
1.68
+0.07
4.34%
jan 1, 1975
1.524
-0.156
-9.29%
jan 1, 1976
2.709
+1.185
77.77%
jan 1, 1977
3.737
+1.028
37.96%
jan 1, 1978
7.422
+3.684
98.59%
jan 1, 1979
7.102
-0.319
-4.3%
jan 1, 1980
3.467
-3.636
-51.19%
jan 1, 1981
4.774
+1.307
37.7%
jan 1, 1982
9.666
+4.892
102.48%
jan 1, 1983
10.817
+1.151
11.91%
jan 1, 1984
8.221
-2.596
-24.0%
jan 1, 1985
13.433
+5.212
63.4%
jan 1, 1986
15.342
+1.909
14.21%
jan 1, 1987
14.186
-1.155
-7.53%
jan 1, 1988
7.543
-6.643
-46.83%
jan 1, 1989
9.879
+2.336
30.96%
jan 1, 1990
6.953
-2.925
-29.61%
jan 1, 1991
5.36
-1.593
-22.91%
jan 1, 1992
3.446
-1.914
-35.7%
jan 1, 1993
2.169
-1.277
-37.07%
jan 1, 1994
2.193
+0.024
1.11%
jan 1, 1995
2.459
+0.266
12.11%
jan 1, 1996
2.299
-0.159
-6.48%
jan 1, 1997
4.044
+1.745
75.9%
jan 1, 1998
3.804
-0.241
-5.95%
jan 1, 1999
2.548
-1.256
-33.01%
jan 1, 2000
2.76
+0.212
8.32%
jan 1, 2001
2.39
-0.37
-13.39%
jan 1, 2002
2.631
+0.241
10.06%
jan 1, 2003
1.02
-1.611
-61.23%
jan 1, 2004
1.174
+0.154
15.1%
jan 1, 2005
1.155
-0.019
-1.6%
jan 1, 2006
1.022
-0.134
-11.56%
jan 1, 2007
1.236
+0.214
20.94%
jan 1, 2008
0.62
-0.616
-49.85%
jan 1, 2009
6.988
+6.368
1.03K%
jan 1, 2010
1.918
-5.07
-72.55%
jan 1, 2011
1.316
-0.602
-31.39%
jan 1, 2012
0.466
-0.85
-64.56%
jan 1, 2013
0.701
+0.234
50.2%
jan 1, 2014
1.523
+0.823
117.44%
jan 1, 2015
1.449
-0.074
-4.88%
jan 1, 2016
1.584
+0.135
9.35%
Ranking of countries by current statistics by years


Comments: