29
/
en
AIzaSyAYiBZKx7MnpbEhh9jyipgxe19OcubqV5w
April 1, 2024
236572
Senegal
SEN
true
2
1
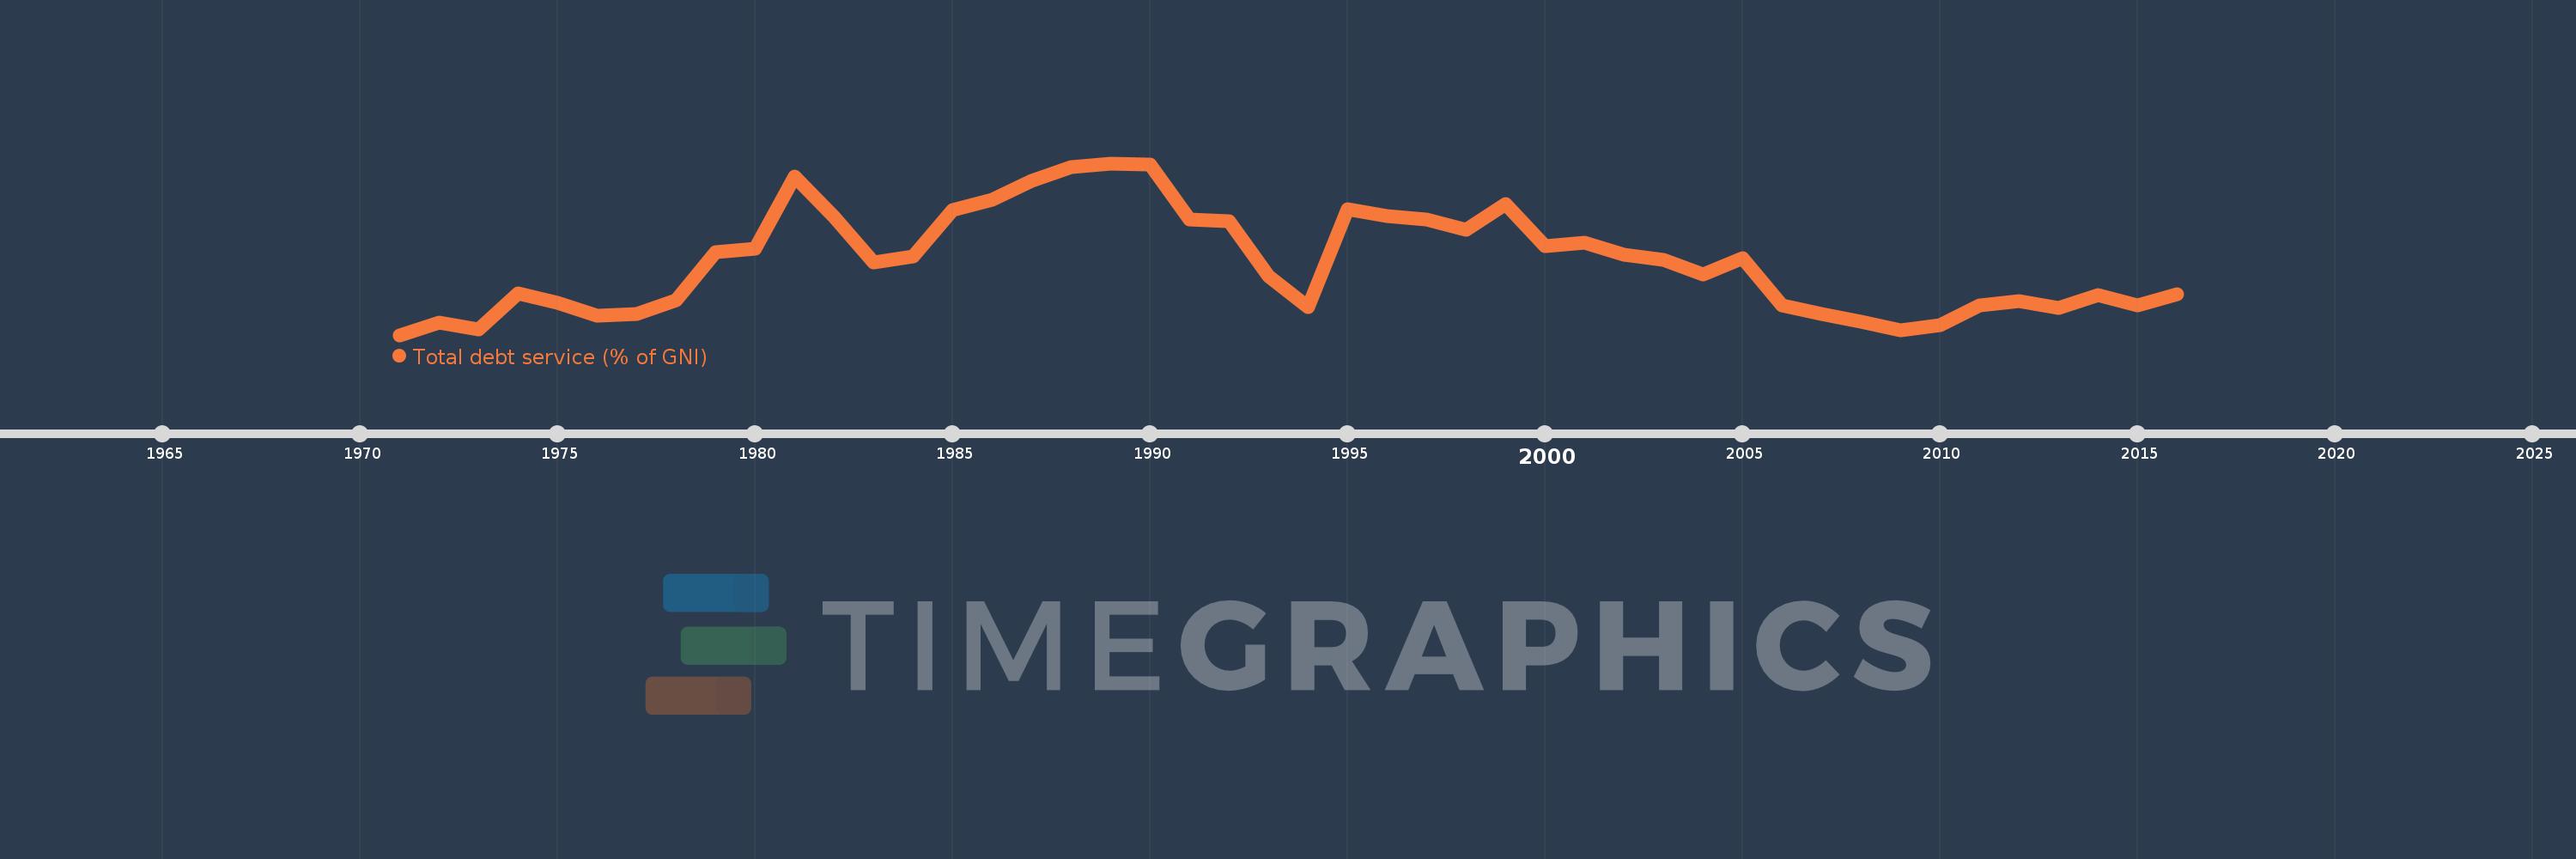
Total debt service (% of GNI)
2016,2015,2014,2013,2012,2011,2010,2009,2008,2007,2006,2005,2004,2003,2002,2001,2000,1999,1998,1997,1996,1995,1994,1993,1992,1991,1990,1989,1988,1987,1986,1985,1984,1983,1982,1981,1980,1979,1978,1977,1976,1975,1974,1973,1972,1971
This statistics in other country:
Timeline:
This timeline shows a graph from 1971 to 2016 of Senegal. No data until 1970. Number of actual observations by date: 46.
Source name:
World Development Indicators
Source organization:
World Bank, International Debt Statistics.
Categories, topics:
Economy & Growth, External Debt
Last updated:
apr 23, 2017
Indicators value changes by year
At the date of observation
Value
Absolute change
Change from previous value
jan 1, 1971
1.161
+1.161
0.0%
jan 1, 1972
1.673
+0.512
44.11%
jan 1, 1973
1.4
-0.273
-16.31%
jan 1, 1974
2.851
+1.451
103.66%
jan 1, 1975
2.479
-0.372
-13.06%
jan 1, 1976
1.951
-0.528
-21.31%
jan 1, 1977
2.022
+0.072
3.68%
jan 1, 1978
2.591
+0.568
28.1%
jan 1, 1979
4.516
+1.926
74.32%
jan 1, 1980
4.675
+0.159
3.52%
jan 1, 1981
7.622
+2.947
63.03%
jan 1, 1982
5.96
-1.662
-21.8%
jan 1, 1983
4.122
-1.838
-30.84%
jan 1, 1984
4.358
+0.236
5.73%
jan 1, 1985
6.261
+1.903
43.68%
jan 1, 1986
6.682
+0.421
6.72%
jan 1, 1987
7.445
+0.763
11.41%
jan 1, 1988
7.992
+0.547
7.35%
jan 1, 1989
8.15
+0.157
1.97%
jan 1, 1990
8.095
-0.055
-0.68%
jan 1, 1991
5.872
-2.222
-27.45%
jan 1, 1992
5.777
-0.096
-1.63%
jan 1, 1993
3.566
-2.211
-38.27%
jan 1, 1994
2.309
-1.257
-35.25%
jan 1, 1995
6.272
+3.963
171.62%
jan 1, 1996
5.989
-0.283
-4.51%
jan 1, 1997
5.859
-0.13
-2.17%
jan 1, 1998
5.459
-0.401
-6.84%
jan 1, 1999
6.502
+1.044
19.12%
jan 1, 2000
4.769
-1.733
-26.66%
jan 1, 2001
4.918
+0.149
3.13%
jan 1, 2002
4.443
-0.475
-9.66%
jan 1, 2003
4.234
-0.209
-4.71%
jan 1, 2004
3.612
-0.622
-14.7%
jan 1, 2005
4.3
+0.688
19.04%
jan 1, 2006
2.38
-1.919
-44.64%
jan 1, 2007
2.01
-0.37
-15.54%
jan 1, 2008
1.7
-0.311
-15.45%
jan 1, 2009
1.36
-0.34
-20.0%
jan 1, 2010
1.568
+0.208
15.29%
jan 1, 2011
2.384
+0.817
52.09%
jan 1, 2012
2.548
+0.163
6.85%
jan 1, 2013
2.273
-0.274
-10.77%
jan 1, 2014
2.772
+0.499
21.97%
jan 1, 2015
2.371
-0.402
-14.48%
jan 1, 2016
2.819
+0.448
18.91%
Ranking of countries by current statistics by years


Comments: