29
/
en
AIzaSyAYiBZKx7MnpbEhh9jyipgxe19OcubqV5w
April 1, 2024
132745
Fiji
FJI
true
2
1
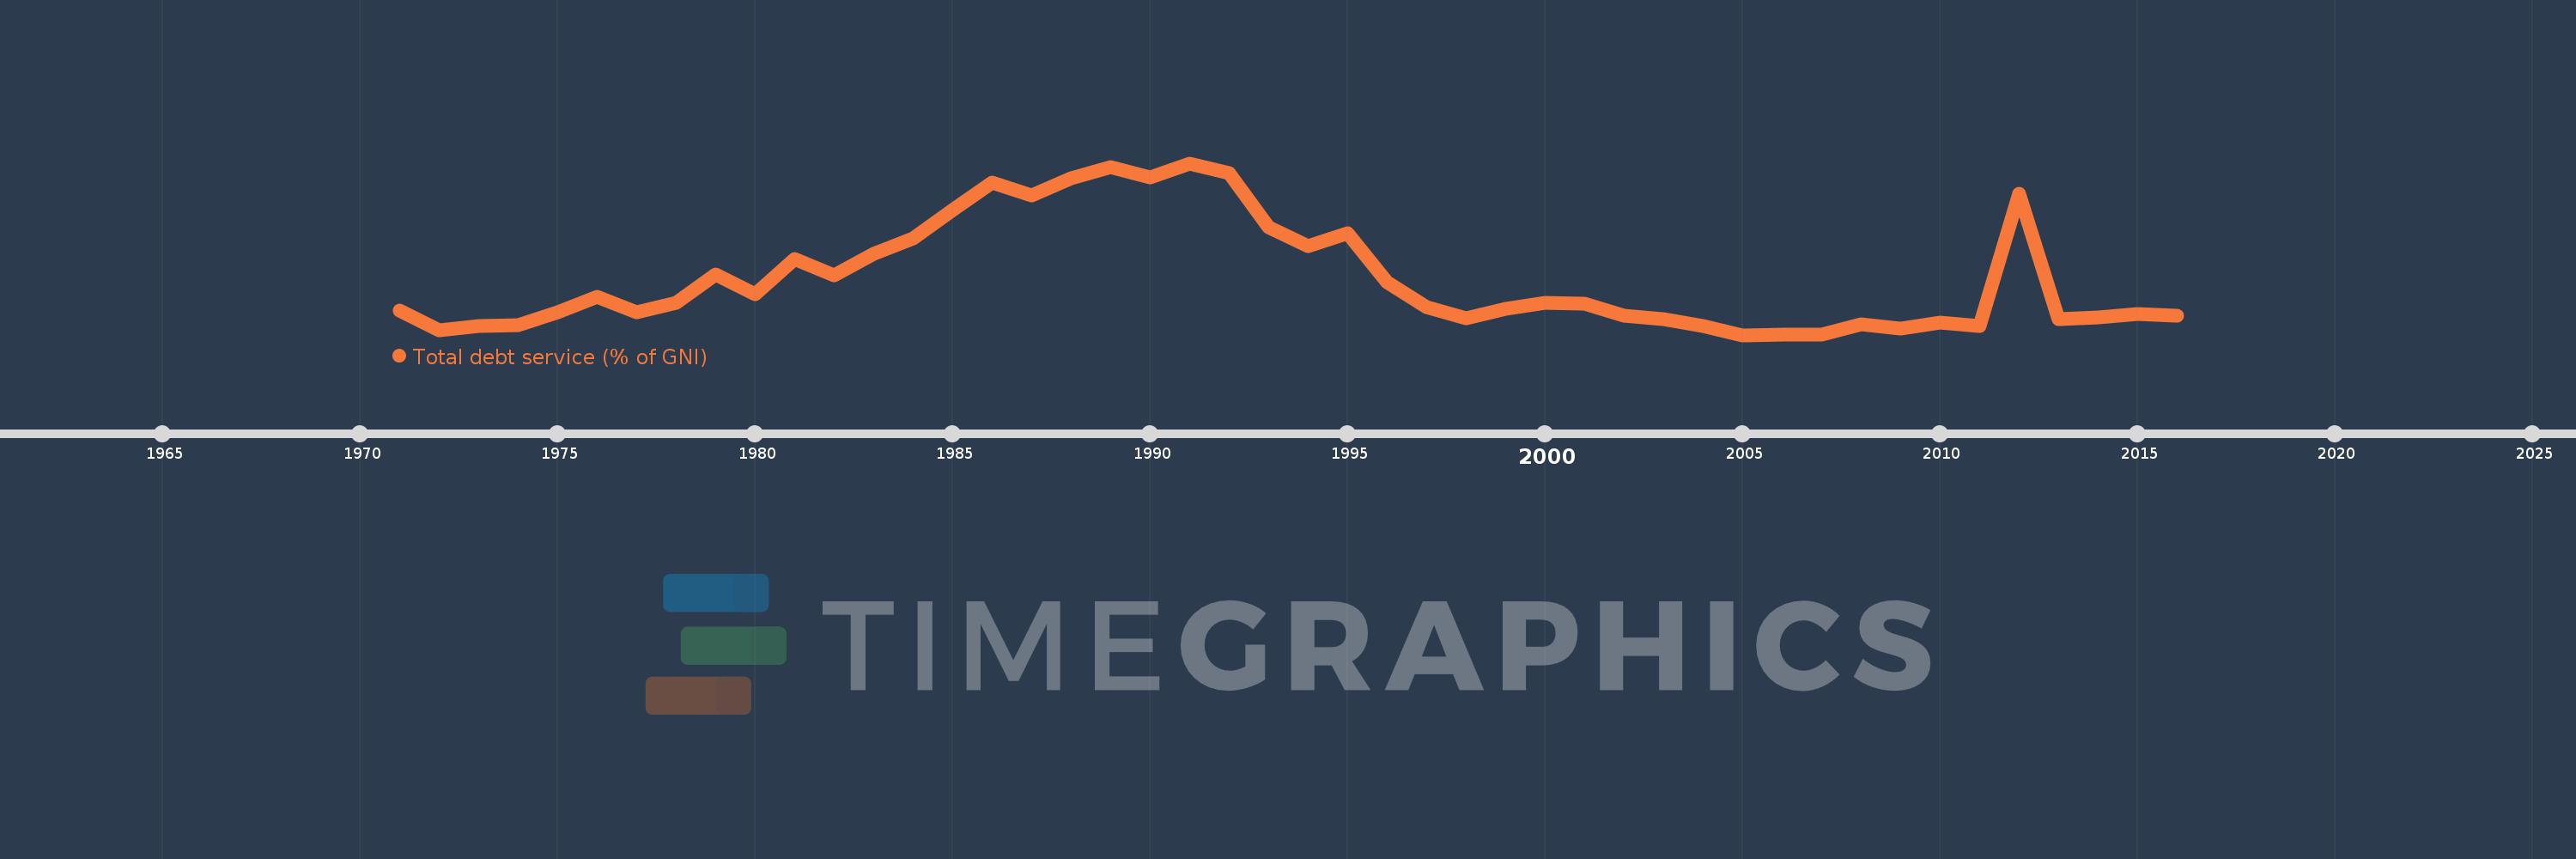
Total debt service (% of GNI)
2016,2015,2014,2013,2012,2011,2010,2009,2008,2007,2006,2005,2004,2003,2002,2001,2000,1999,1998,1997,1996,1995,1994,1993,1992,1991,1990,1989,1988,1987,1986,1985,1984,1983,1982,1981,1980,1979,1978,1977,1976,1975,1974,1973,1972,1971
This statistics in other country:
Timeline:
This timeline shows a graph from 1971 to 2016 of Fiji. No data until 1970. Number of actual observations by date: 46.
Source name:
World Development Indicators
Source organization:
World Bank, International Debt Statistics.
Categories, topics:
Economy & Growth, External Debt
Last updated:
apr 23, 2017
Indicators value changes by year
At the date of observation
Value
Absolute change
Change from previous value
jan 1, 1971
1.293
+1.293
0.0%
jan 1, 1972
0.628
-0.665
-51.43%
jan 1, 1973
0.785
+0.157
24.97%
jan 1, 1974
0.82
+0.035
4.45%
jan 1, 1975
1.235
+0.415
50.63%
jan 1, 1976
1.75
+0.515
41.72%
jan 1, 1977
1.243
-0.507
-28.96%
jan 1, 1978
1.562
+0.319
25.62%
jan 1, 1979
2.505
+0.943
60.39%
jan 1, 1980
1.844
-0.661
-26.37%
jan 1, 1981
3.026
+1.181
64.03%
jan 1, 1982
2.501
-0.525
-17.34%
jan 1, 1983
3.21
+0.709
28.36%
jan 1, 1984
3.736
+0.526
16.39%
jan 1, 1985
4.682
+0.946
25.32%
jan 1, 1986
5.628
+0.945
20.19%
jan 1, 1987
5.197
-0.431
-7.66%
jan 1, 1988
5.771
+0.575
11.06%
jan 1, 1989
6.149
+0.377
6.54%
jan 1, 1990
5.798
-0.351
-5.7%
jan 1, 1991
6.276
+0.478
8.24%
jan 1, 1992
5.934
-0.342
-5.45%
jan 1, 1993
4.1
-1.834
-30.91%
jan 1, 1994
3.467
-0.633
-15.43%
jan 1, 1995
3.919
+0.452
13.03%
jan 1, 1996
2.249
-1.67
-42.61%
jan 1, 1997
1.413
-0.837
-37.19%
jan 1, 1998
1.042
-0.37
-26.23%
jan 1, 1999
1.36
+0.318
30.55%
jan 1, 2000
1.55
+0.189
13.93%
jan 1, 2001
1.543
-0.007
-0.47%
jan 1, 2002
1.116
-0.426
-27.63%
jan 1, 2003
1.02
-0.096
-8.6%
jan 1, 2004
0.776
-0.245
-23.97%
jan 1, 2005
0.472
-0.304
-39.19%
jan 1, 2006
0.495
+0.023
4.96%
jan 1, 2007
0.478
-0.017
-3.46%
jan 1, 2008
0.844
+0.366
76.62%
jan 1, 2009
0.7
-0.144
-17.04%
jan 1, 2010
0.906
+0.206
29.41%
jan 1, 2011
0.774
-0.132
-14.57%
jan 1, 2012
5.244
+4.469
577.21%
jan 1, 2013
1.013
-4.231
-80.68%
jan 1, 2014
1.068
+0.055
5.45%
jan 1, 2015
1.195
+0.127
11.92%
jan 1, 2016
1.133
-0.062
-5.22%
Ranking of countries by current statistics by years


Comments: