29
/
en
AIzaSyAYiBZKx7MnpbEhh9jyipgxe19OcubqV5w
April 1, 2024
263084
Thailand
THA
true
2
1
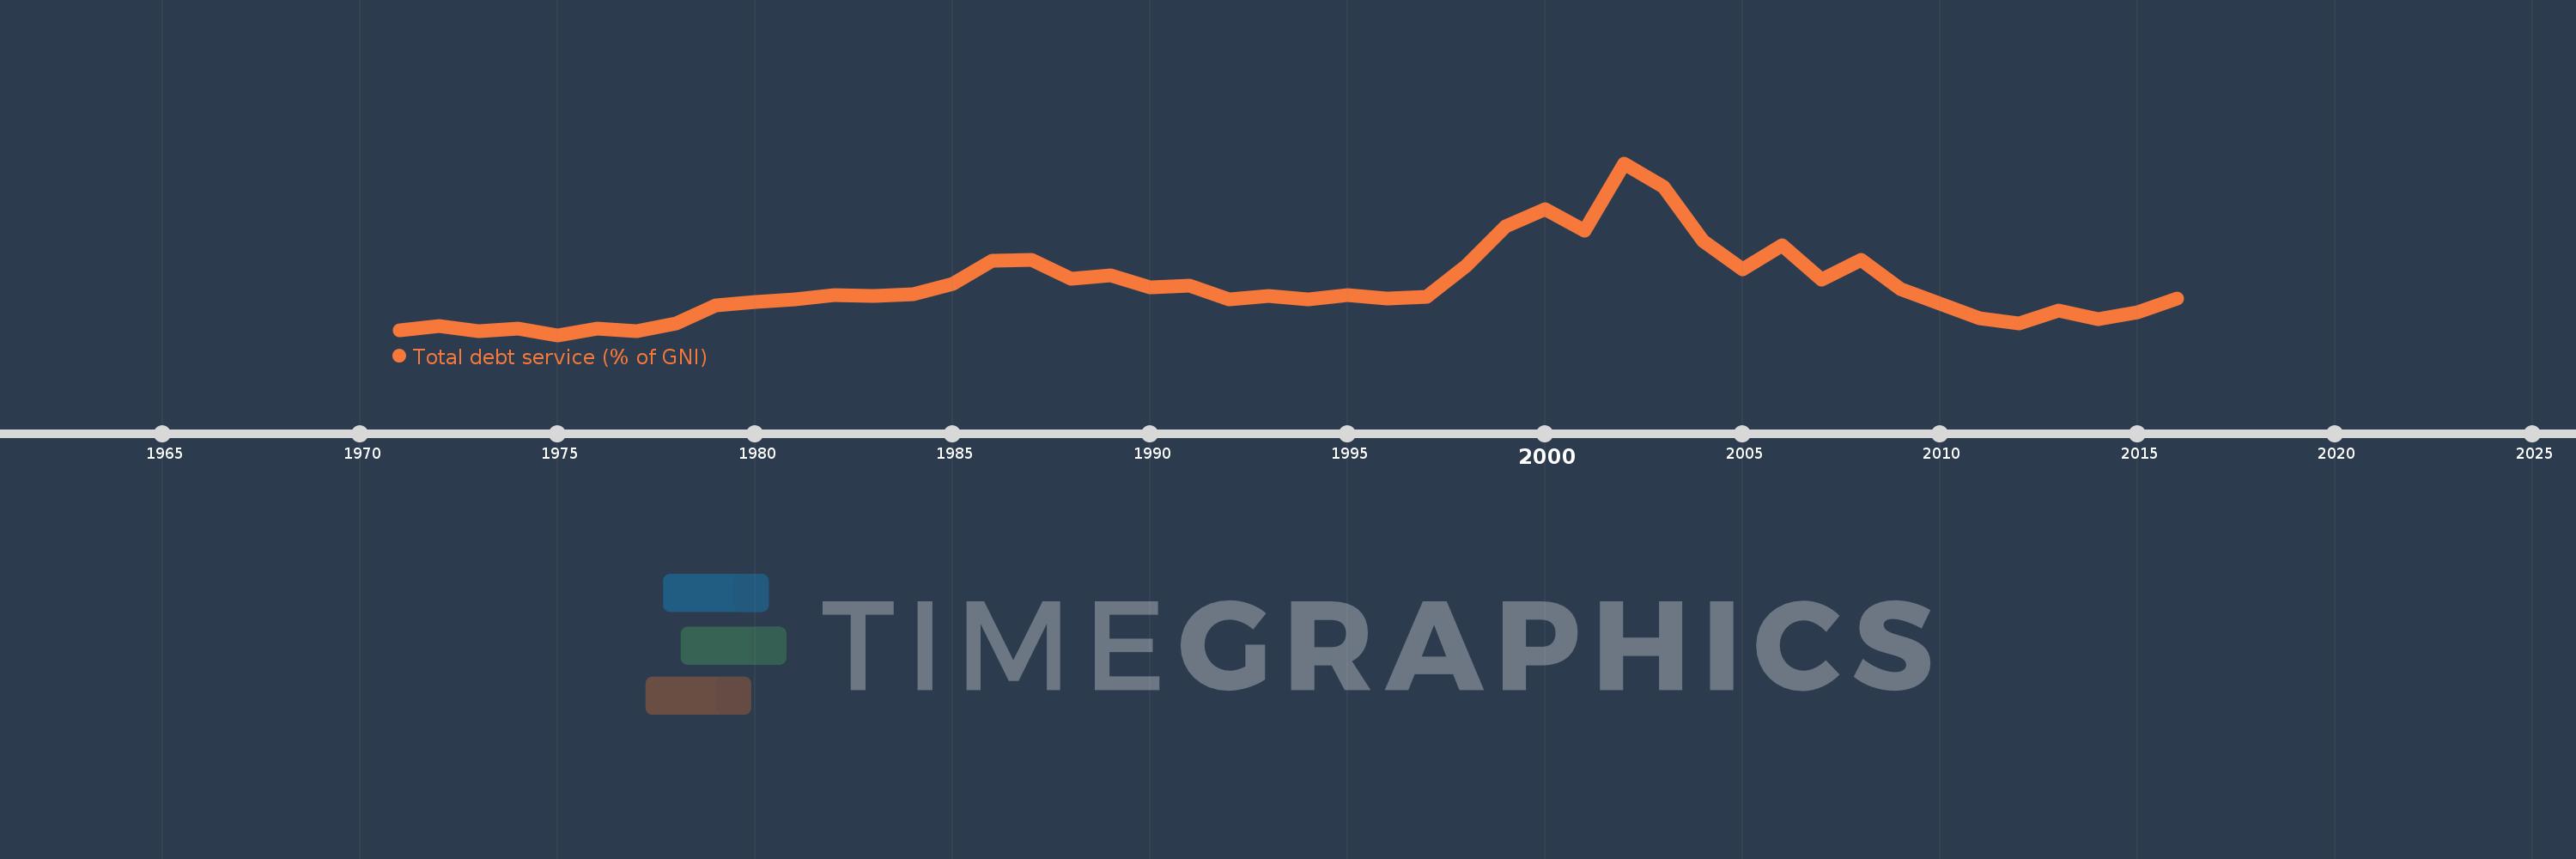
Total debt service (% of GNI)
2016,2015,2014,2013,2012,2011,2010,2009,2008,2007,2006,2005,2004,2003,2002,2001,2000,1999,1998,1997,1996,1995,1994,1993,1992,1991,1990,1989,1988,1987,1986,1985,1984,1983,1982,1981,1980,1979,1978,1977,1976,1975,1974,1973,1972,1971
This statistics in other country:
Timeline:
This timeline shows a graph from 1971 to 2016 of Thailand. No data until 1970. Number of actual observations by date: 46.
Source name:
World Development Indicators
Source organization:
World Bank, International Debt Statistics.
Categories, topics:
Economy & Growth, External Debt
Last updated:
apr 23, 2017
Indicators value changes by year
Maximum:
17.372
jan 1, 2002
At the date of observation
Value
Absolute change
Change from previous value
jan 1, 1971
2.304
+2.304
0.0%
jan 1, 1972
2.673
+0.369
16.01%
jan 1, 1973
2.235
-0.437
-16.36%
jan 1, 1974
2.47
+0.235
10.5%
jan 1, 1975
1.853
-0.617
-24.97%
jan 1, 1976
2.401
+0.547
29.54%
jan 1, 1977
2.234
-0.167
-6.95%
jan 1, 1978
2.9
+0.666
29.83%
jan 1, 1979
4.539
+1.639
56.51%
jan 1, 1980
4.842
+0.303
6.68%
jan 1, 1981
5.04
+0.198
4.09%
jan 1, 1982
5.468
+0.428
8.49%
jan 1, 1983
5.385
-0.084
-1.53%
jan 1, 1984
5.568
+0.183
3.41%
jan 1, 1985
6.481
+0.913
16.39%
jan 1, 1986
8.529
+2.048
31.6%
jan 1, 1987
8.654
+0.125
1.47%
jan 1, 1988
6.964
-1.69
-19.53%
jan 1, 1989
7.232
+0.268
3.85%
jan 1, 1990
6.167
-1.065
-14.72%
jan 1, 1991
6.283
+0.116
1.88%
jan 1, 1992
5.074
-1.209
-19.24%
jan 1, 1993
5.422
+0.348
6.85%
jan 1, 1994
5.082
-0.34
-6.27%
jan 1, 1995
5.47
+0.388
7.63%
jan 1, 1996
5.179
-0.291
-5.32%
jan 1, 1997
5.343
+0.164
3.16%
jan 1, 1998
8.111
+2.768
51.82%
jan 1, 1999
11.675
+3.564
43.94%
jan 1, 2000
13.232
+1.557
13.34%
jan 1, 2001
11.31
-1.922
-14.53%
jan 1, 2002
17.372
+6.062
53.6%
jan 1, 2003
15.224
-2.148
-12.37%
jan 1, 2004
10.325
-4.899
-32.18%
jan 1, 2005
7.791
-2.534
-24.55%
jan 1, 2006
9.979
+2.188
28.08%
jan 1, 2007
6.863
-3.116
-31.22%
jan 1, 2008
8.662
+1.799
26.21%
jan 1, 2009
6.021
-2.64
-30.48%
jan 1, 2010
4.679
-1.342
-22.29%
jan 1, 2011
3.365
-1.315
-28.09%
jan 1, 2012
2.891
-0.474
-14.08%
jan 1, 2013
4.033
+1.143
39.52%
jan 1, 2014
3.271
-0.762
-18.89%
jan 1, 2015
3.897
+0.626
19.12%
jan 1, 2016
5.137
+1.24
31.83%
Ranking of countries by current statistics by years


Comments: