29
/
en
AIzaSyAYiBZKx7MnpbEhh9jyipgxe19OcubqV5w
April 1, 2024
270158
Turkey
TUR
true
2
1
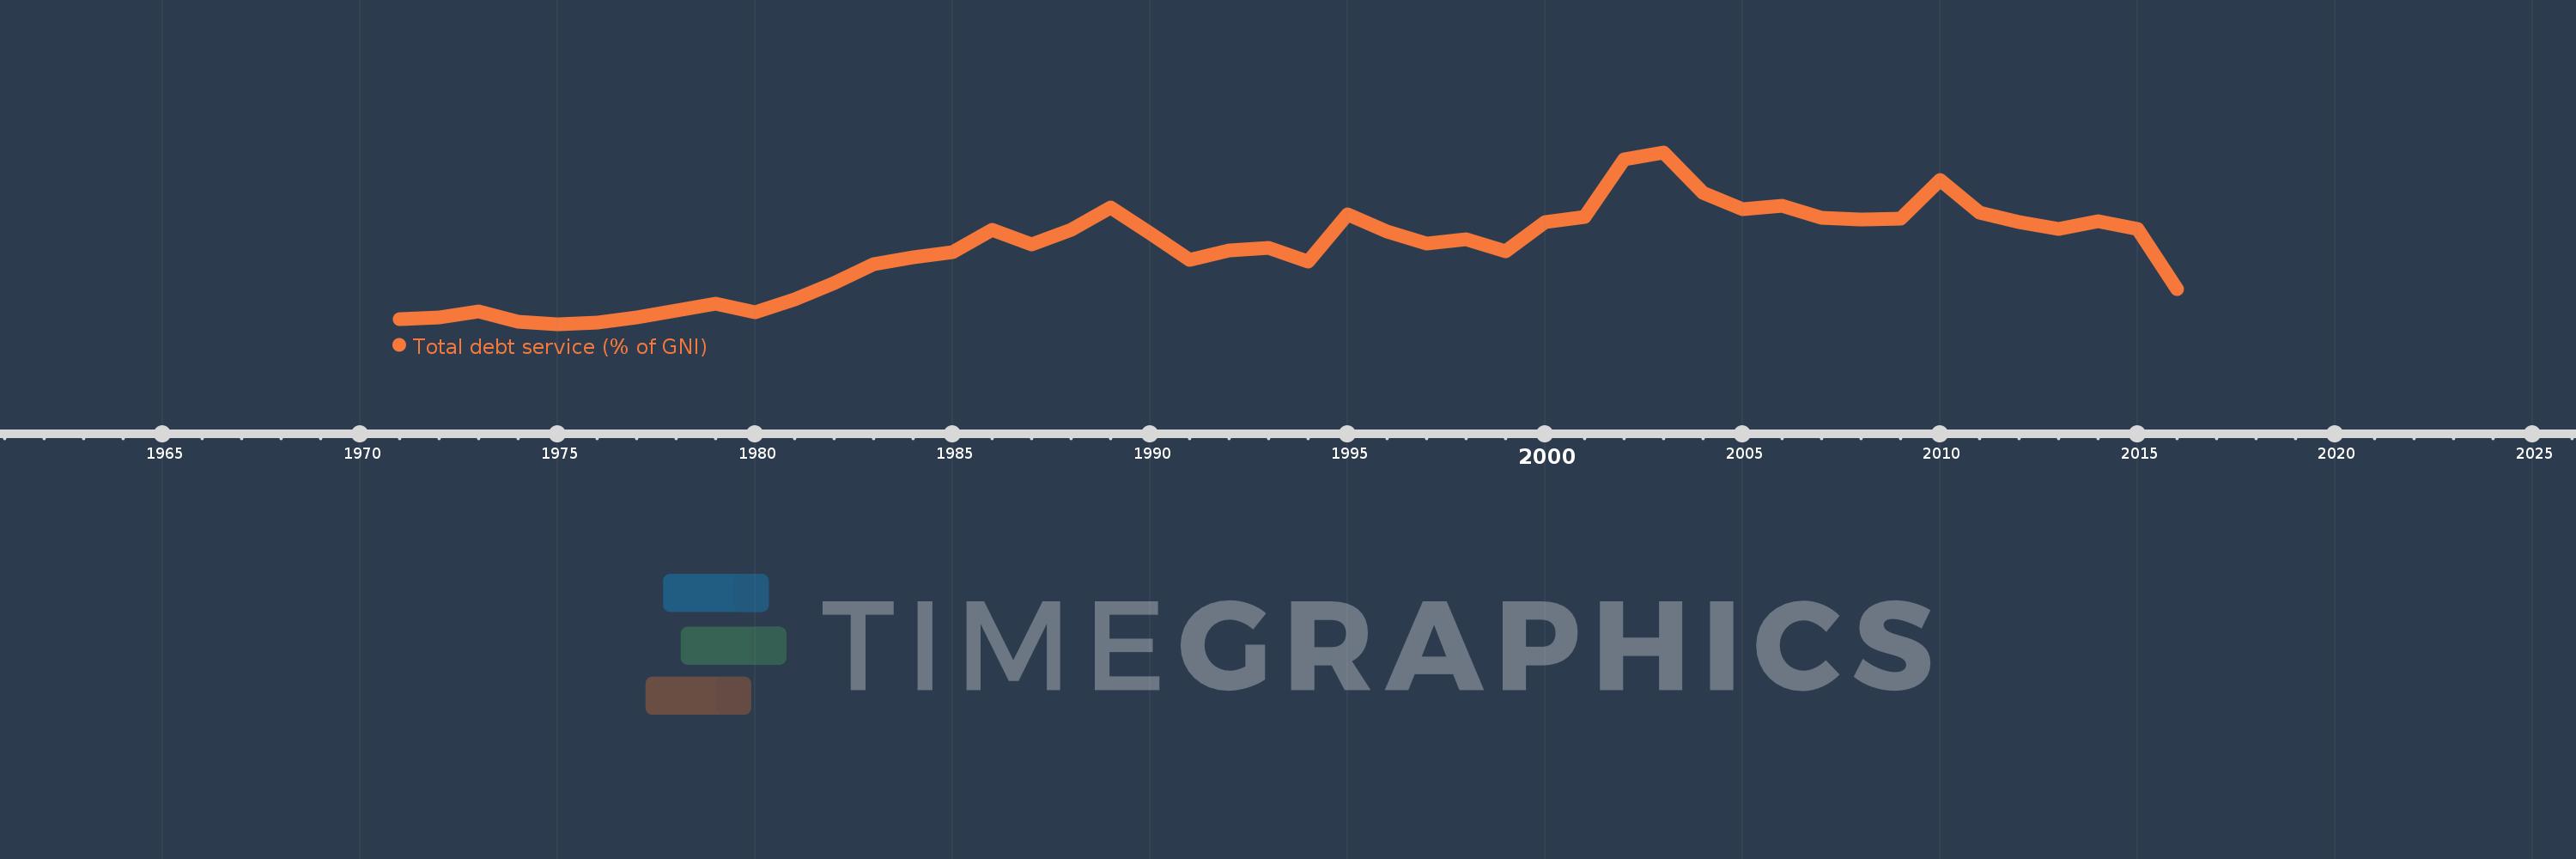
Total debt service (% of GNI)
2016,2015,2014,2013,2012,2011,2010,2009,2008,2007,2006,2005,2004,2003,2002,2001,2000,1999,1998,1997,1996,1995,1994,1993,1992,1991,1990,1989,1988,1987,1986,1985,1984,1983,1982,1981,1980,1979,1978,1977,1976,1975,1974,1973,1972,1971
This statistics in other country:
Timeline:
This timeline shows a graph from 1971 to 2016 of Turkey. No data until 1970. Number of actual observations by date: 46.
Source name:
World Development Indicators
Source organization:
World Bank, International Debt Statistics.
Categories, topics:
Economy & Growth, External Debt
Last updated:
apr 23, 2017
Indicators value changes by year
Maximum:
12.185
jan 1, 2003
At the date of observation
Value
Absolute change
Change from previous value
jan 1, 1971
1.042
+1.042
0.0%
jan 1, 1972
1.201
+0.159
15.3%
jan 1, 1973
1.586
+0.384
32.0%
jan 1, 1974
0.876
-0.71
-44.75%
jan 1, 1975
0.727
-0.149
-17.0%
jan 1, 1976
0.846
+0.119
16.36%
jan 1, 1977
1.156
+0.31
36.66%
jan 1, 1978
1.634
+0.478
41.34%
jan 1, 1979
2.09
+0.456
27.9%
jan 1, 1980
1.517
-0.574
-27.44%
jan 1, 1981
2.376
+0.859
56.64%
jan 1, 1982
3.447
+1.072
45.11%
jan 1, 1983
4.705
+1.257
36.47%
jan 1, 1984
5.209
+0.504
10.72%
jan 1, 1985
5.512
+0.302
5.8%
jan 1, 1986
7.006
+1.494
27.11%
jan 1, 1987
6.057
-0.949
-13.55%
jan 1, 1988
7.029
+0.973
16.06%
jan 1, 1989
8.52
+1.491
21.21%
jan 1, 1990
6.766
-1.754
-20.59%
jan 1, 1991
5.009
-1.757
-25.97%
jan 1, 1992
5.624
+0.615
12.28%
jan 1, 1993
5.83
+0.206
3.67%
jan 1, 1994
4.883
-0.947
-16.24%
jan 1, 1995
8.05
+3.167
64.86%
jan 1, 1996
6.887
-1.164
-14.45%
jan 1, 1997
6.111
-0.775
-11.26%
jan 1, 1998
6.377
+0.265
4.34%
jan 1, 1999
5.619
-0.757
-11.88%
jan 1, 2000
7.557
+1.938
34.49%
jan 1, 2001
7.88
+0.323
4.27%
jan 1, 2002
11.694
+3.814
48.4%
jan 1, 2003
12.185
+0.491
4.2%
jan 1, 2004
9.459
-2.726
-22.37%
jan 1, 2005
8.408
-1.051
-11.11%
jan 1, 2006
8.65
+0.241
2.87%
jan 1, 2007
7.826
-0.823
-9.52%
jan 1, 2008
7.713
-0.113
-1.45%
jan 1, 2009
7.741
+0.028
0.37%
jan 1, 2010
10.358
+2.617
33.8%
jan 1, 2011
8.193
-2.165
-20.9%
jan 1, 2012
7.562
-0.631
-7.7%
jan 1, 2013
7.078
-0.484
-6.4%
jan 1, 2014
7.569
+0.491
6.94%
jan 1, 2015
7.058
-0.511
-6.75%
jan 1, 2016
3.076
-3.983
-56.43%
Ranking of countries by current statistics by years


Comments: