29
/
en
AIzaSyAYiBZKx7MnpbEhh9jyipgxe19OcubqV5w
April 1, 2024
113076
Costa Rica
CRI
true
2
1
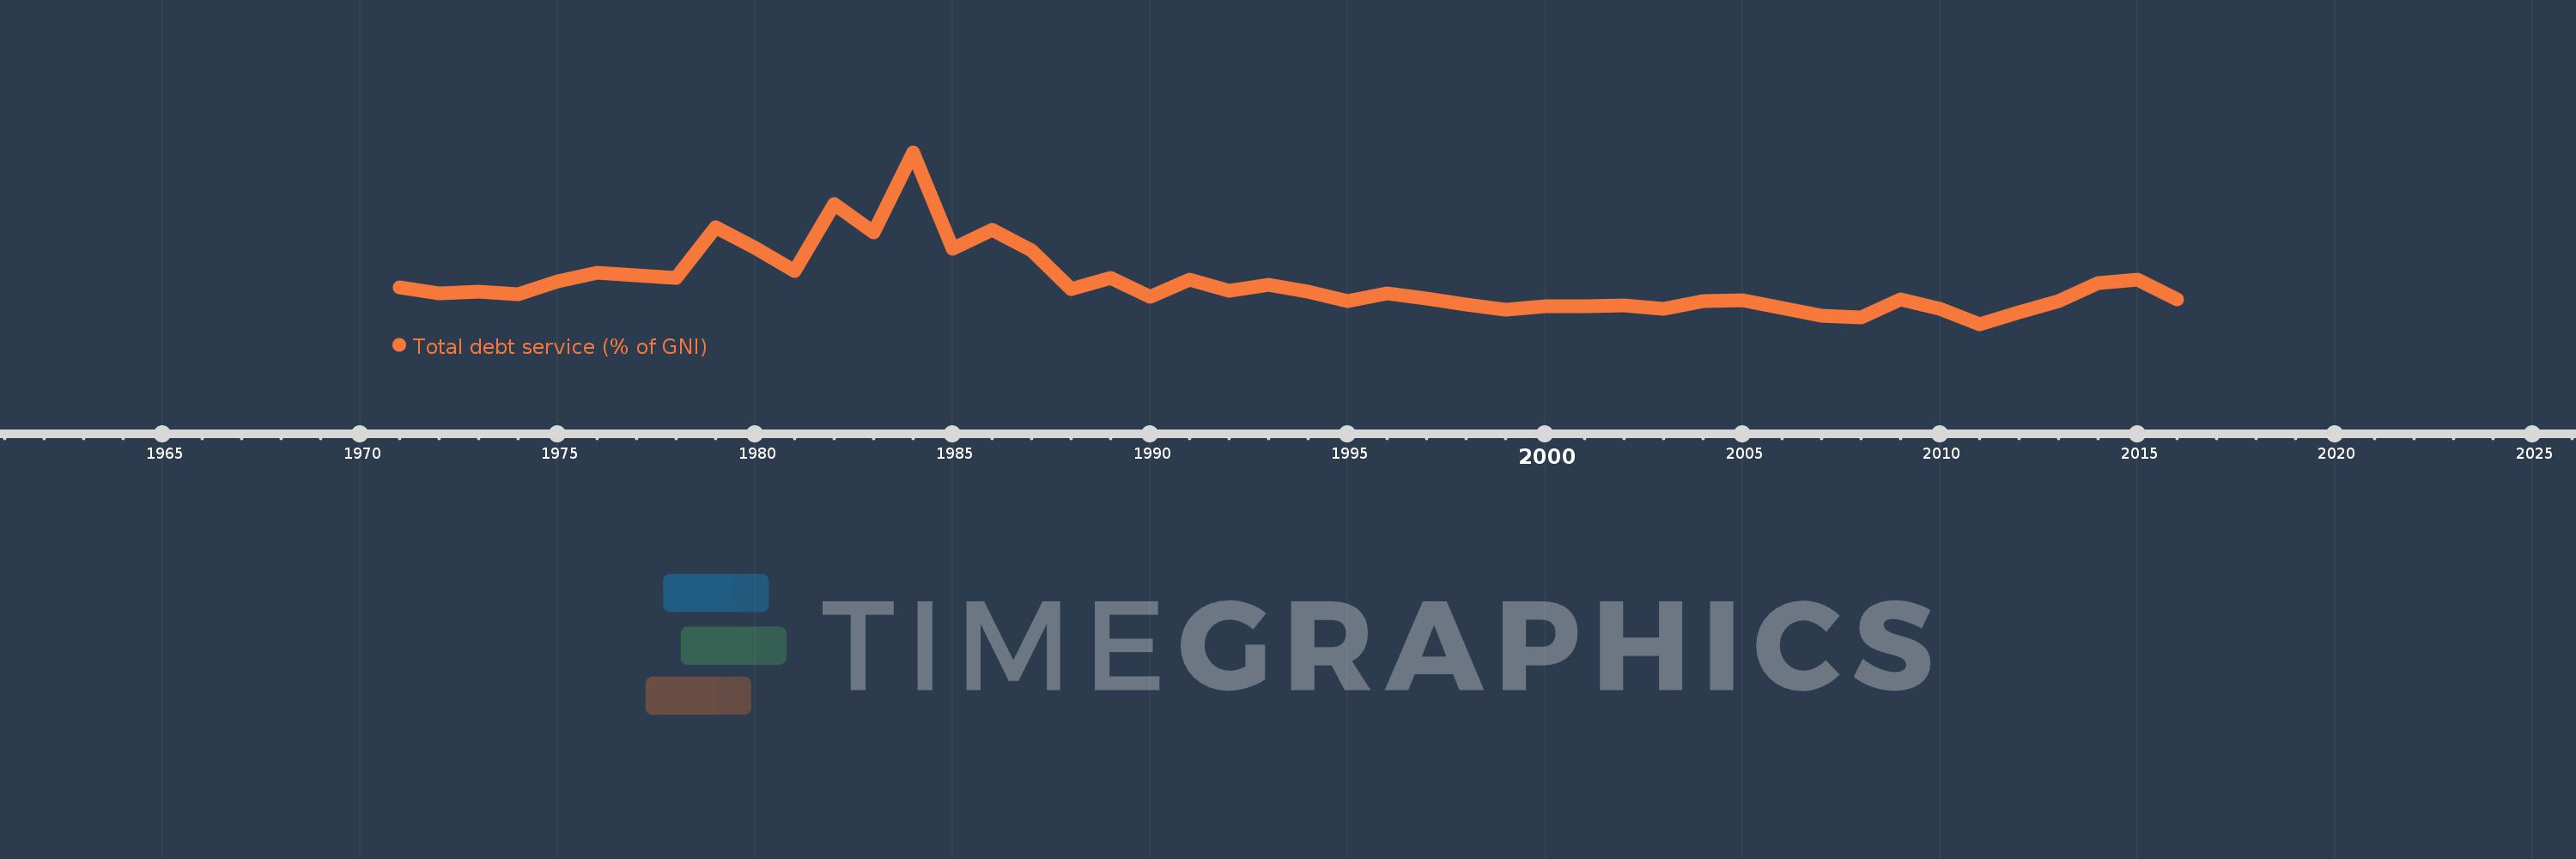
Total debt service (% of GNI)
2016,2015,2014,2013,2012,2011,2010,2009,2008,2007,2006,2005,2004,2003,2002,2001,2000,1999,1998,1997,1996,1995,1994,1993,1992,1991,1990,1989,1988,1987,1986,1985,1984,1983,1982,1981,1980,1979,1978,1977,1976,1975,1974,1973,1972,1971
This statistics in other country:
Timeline:
This timeline shows a graph from 1971 to 2016 of Costa Rica. No data until 1970. Number of actual observations by date: 46.
Source name:
World Development Indicators
Source organization:
World Bank, International Debt Statistics.
Categories, topics:
Economy & Growth, External Debt
Last updated:
apr 23, 2017
Indicators value changes by year
Maximum:
19.807
jan 1, 1984
At the date of observation
Value
Absolute change
Change from previous value
jan 1, 1971
6.407
+6.407
0.0%
jan 1, 1972
5.84
-0.568
-8.86%
jan 1, 1973
5.979
+0.14
2.39%
jan 1, 1974
5.72
-0.259
-4.33%
jan 1, 1975
7.01
+1.29
22.54%
jan 1, 1976
7.829
+0.819
11.69%
jan 1, 1977
7.613
-0.216
-2.76%
jan 1, 1978
7.375
-0.238
-3.13%
jan 1, 1979
12.378
+5.003
67.84%
jan 1, 1980
10.318
-2.06
-16.64%
jan 1, 1981
8.027
-2.292
-22.21%
jan 1, 1982
14.724
+6.698
83.44%
jan 1, 1983
11.892
-2.832
-19.24%
jan 1, 1984
19.807
+7.915
66.56%
jan 1, 1985
10.248
-9.559
-48.26%
jan 1, 1986
12.167
+1.919
18.73%
jan 1, 1987
10.099
-2.067
-16.99%
jan 1, 1988
6.269
-3.83
-37.93%
jan 1, 1989
7.347
+1.078
17.2%
jan 1, 1990
5.508
-1.838
-25.02%
jan 1, 1991
7.182
+1.673
30.38%
jan 1, 1992
6.122
-1.06
-14.76%
jan 1, 1993
6.655
+0.534
8.72%
jan 1, 1994
6.024
-0.631
-9.49%
jan 1, 1995
5.031
-0.993
-16.49%
jan 1, 1996
5.85
+0.819
16.28%
jan 1, 1997
5.309
-0.541
-9.25%
jan 1, 1998
4.684
-0.625
-11.77%
jan 1, 1999
4.221
-0.463
-9.88%
jan 1, 2000
4.543
+0.322
7.62%
jan 1, 2001
4.577
+0.034
0.75%
jan 1, 2002
4.596
+0.019
0.42%
jan 1, 2003
4.285
-0.311
-6.77%
jan 1, 2004
5.042
+0.757
17.66%
jan 1, 2005
5.12
+0.079
1.56%
jan 1, 2006
4.372
-0.748
-14.61%
jan 1, 2007
3.584
-0.789
-18.04%
jan 1, 2008
3.458
-0.125
-3.5%
jan 1, 2009
5.242
+1.784
51.59%
jan 1, 2010
4.251
-0.992
-18.92%
jan 1, 2011
2.767
-1.483
-34.89%
jan 1, 2012
3.977
+1.21
43.71%
jan 1, 2013
5.083
+1.106
27.8%
jan 1, 2014
6.875
+1.792
35.26%
jan 1, 2015
7.202
+0.327
4.76%
jan 1, 2016
5.27
-1.932
-26.83%
Ranking of countries by current statistics by years


Comments: