29
/
en
AIzaSyAYiBZKx7MnpbEhh9jyipgxe19OcubqV5w
April 1, 2024
40396
IDA total
IDA
false
2
1
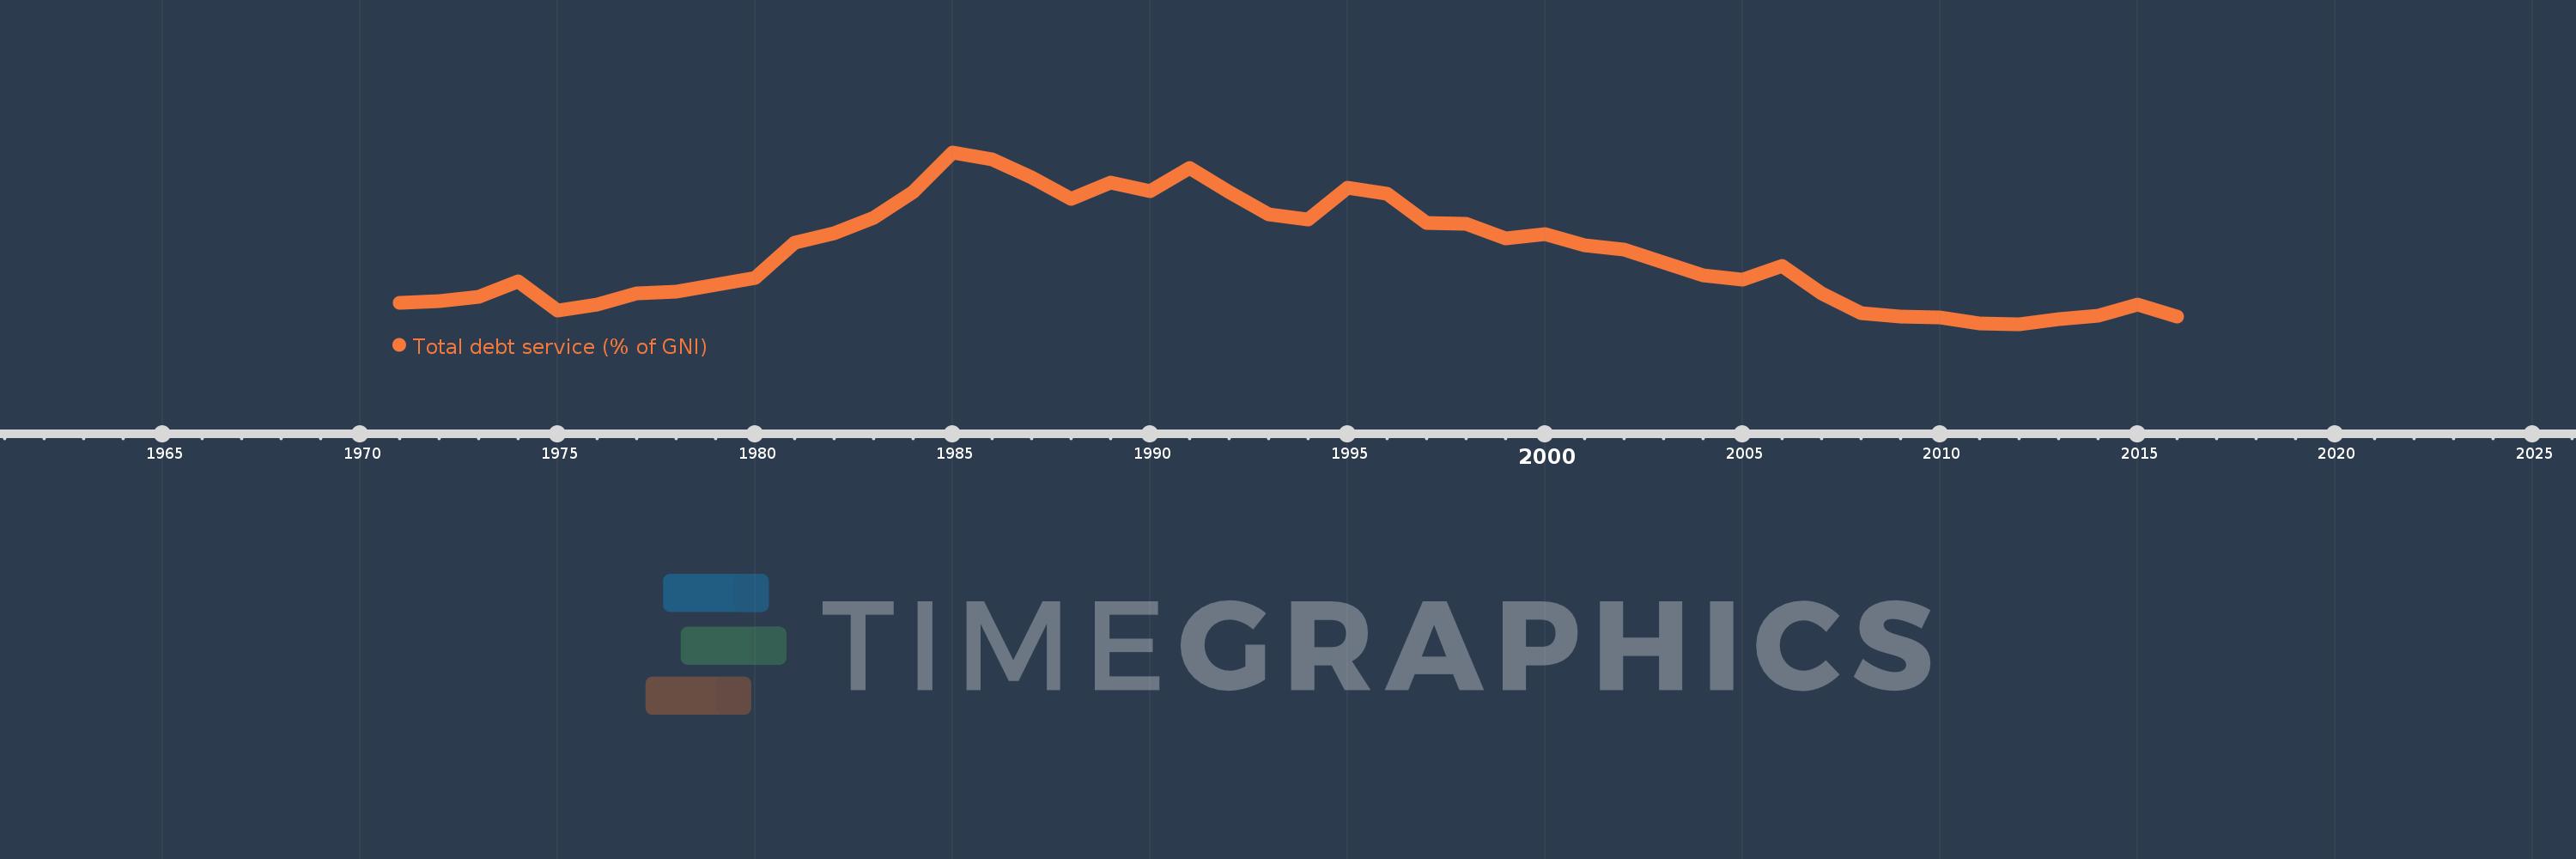
Total debt service (% of GNI)
2016,2015,2014,2013,2012,2011,2010,2009,2008,2007,2006,2005,2004,2003,2002,2001,2000,1999,1998,1997,1996,1995,1994,1993,1992,1991,1990,1989,1988,1987,1986,1985,1984,1983,1982,1981,1980,1979,1978,1977,1976,1975,1974,1973,1972,1971
This statistics in other country:
Timeline:
This timeline shows a graph from 1971 to 2016 of IDA total. No data until 1970. Number of actual observations by date: 46.
Source name:
World Development Indicators
Source organization:
World Bank, International Debt Statistics.
Categories, topics:
Economy & Growth, External Debt
Last updated:
apr 23, 2017
Indicators value changes by year
At the date of observation
Value
Absolute change
Change from previous value
jan 1, 1971
1.997
+1.997
0.0%
jan 1, 1972
2.061
+0.063
3.16%
jan 1, 1973
2.178
+0.117
5.69%
jan 1, 1974
2.648
+0.47
21.59%
jan 1, 1975
1.767
-0.881
-33.26%
jan 1, 1976
1.962
+0.194
10.99%
jan 1, 1977
2.285
+0.323
16.47%
jan 1, 1978
2.331
+0.047
2.04%
jan 1, 1979
2.544
+0.213
9.14%
jan 1, 1980
2.735
+0.19
7.49%
jan 1, 1981
3.772
+1.037
37.93%
jan 1, 1982
4.055
+0.283
7.52%
jan 1, 1983
4.522
+0.467
11.52%
jan 1, 1984
5.26
+0.738
16.32%
jan 1, 1985
6.436
+1.176
22.35%
jan 1, 1986
6.236
-0.2
-3.1%
jan 1, 1987
5.688
-0.548
-8.79%
jan 1, 1988
5.076
-0.612
-10.76%
jan 1, 1989
5.551
+0.476
9.37%
jan 1, 1990
5.301
-0.251
-4.51%
jan 1, 1991
5.969
+0.669
12.61%
jan 1, 1992
5.274
-0.695
-11.64%
jan 1, 1993
4.6
-0.675
-12.79%
jan 1, 1994
4.465
-0.134
-2.92%
jan 1, 1995
5.401
+0.936
20.97%
jan 1, 1996
5.228
-0.173
-3.2%
jan 1, 1997
4.357
-0.871
-16.66%
jan 1, 1998
4.332
-0.025
-0.58%
jan 1, 1999
3.91
-0.422
-9.73%
jan 1, 2000
4.035
+0.125
3.19%
jan 1, 2001
3.703
-0.332
-8.23%
jan 1, 2002
3.578
-0.125
-3.38%
jan 1, 2003
3.202
-0.376
-10.5%
jan 1, 2004
2.82
-0.383
-11.95%
jan 1, 2005
2.697
-0.122
-4.34%
jan 1, 2006
3.101
+0.404
14.98%
jan 1, 2007
2.275
-0.826
-26.64%
jan 1, 2008
1.698
-0.577
-25.36%
jan 1, 2009
1.592
-0.106
-6.22%
jan 1, 2010
1.582
-0.01
-0.63%
jan 1, 2011
1.391
-0.192
-12.11%
jan 1, 2012
1.374
-0.017
-1.22%
jan 1, 2013
1.535
+0.162
11.76%
jan 1, 2014
1.635
+0.1
6.48%
jan 1, 2015
1.942
+0.307
18.79%
jan 1, 2016
1.608
-0.334
-17.19%
Ranking of countries by current statistics by years


Comments: