29
/
en
AIzaSyAYiBZKx7MnpbEhh9jyipgxe19OcubqV5w
April 1, 2024
125624
Egypt, Arab Rep.
EGY
true
2
1
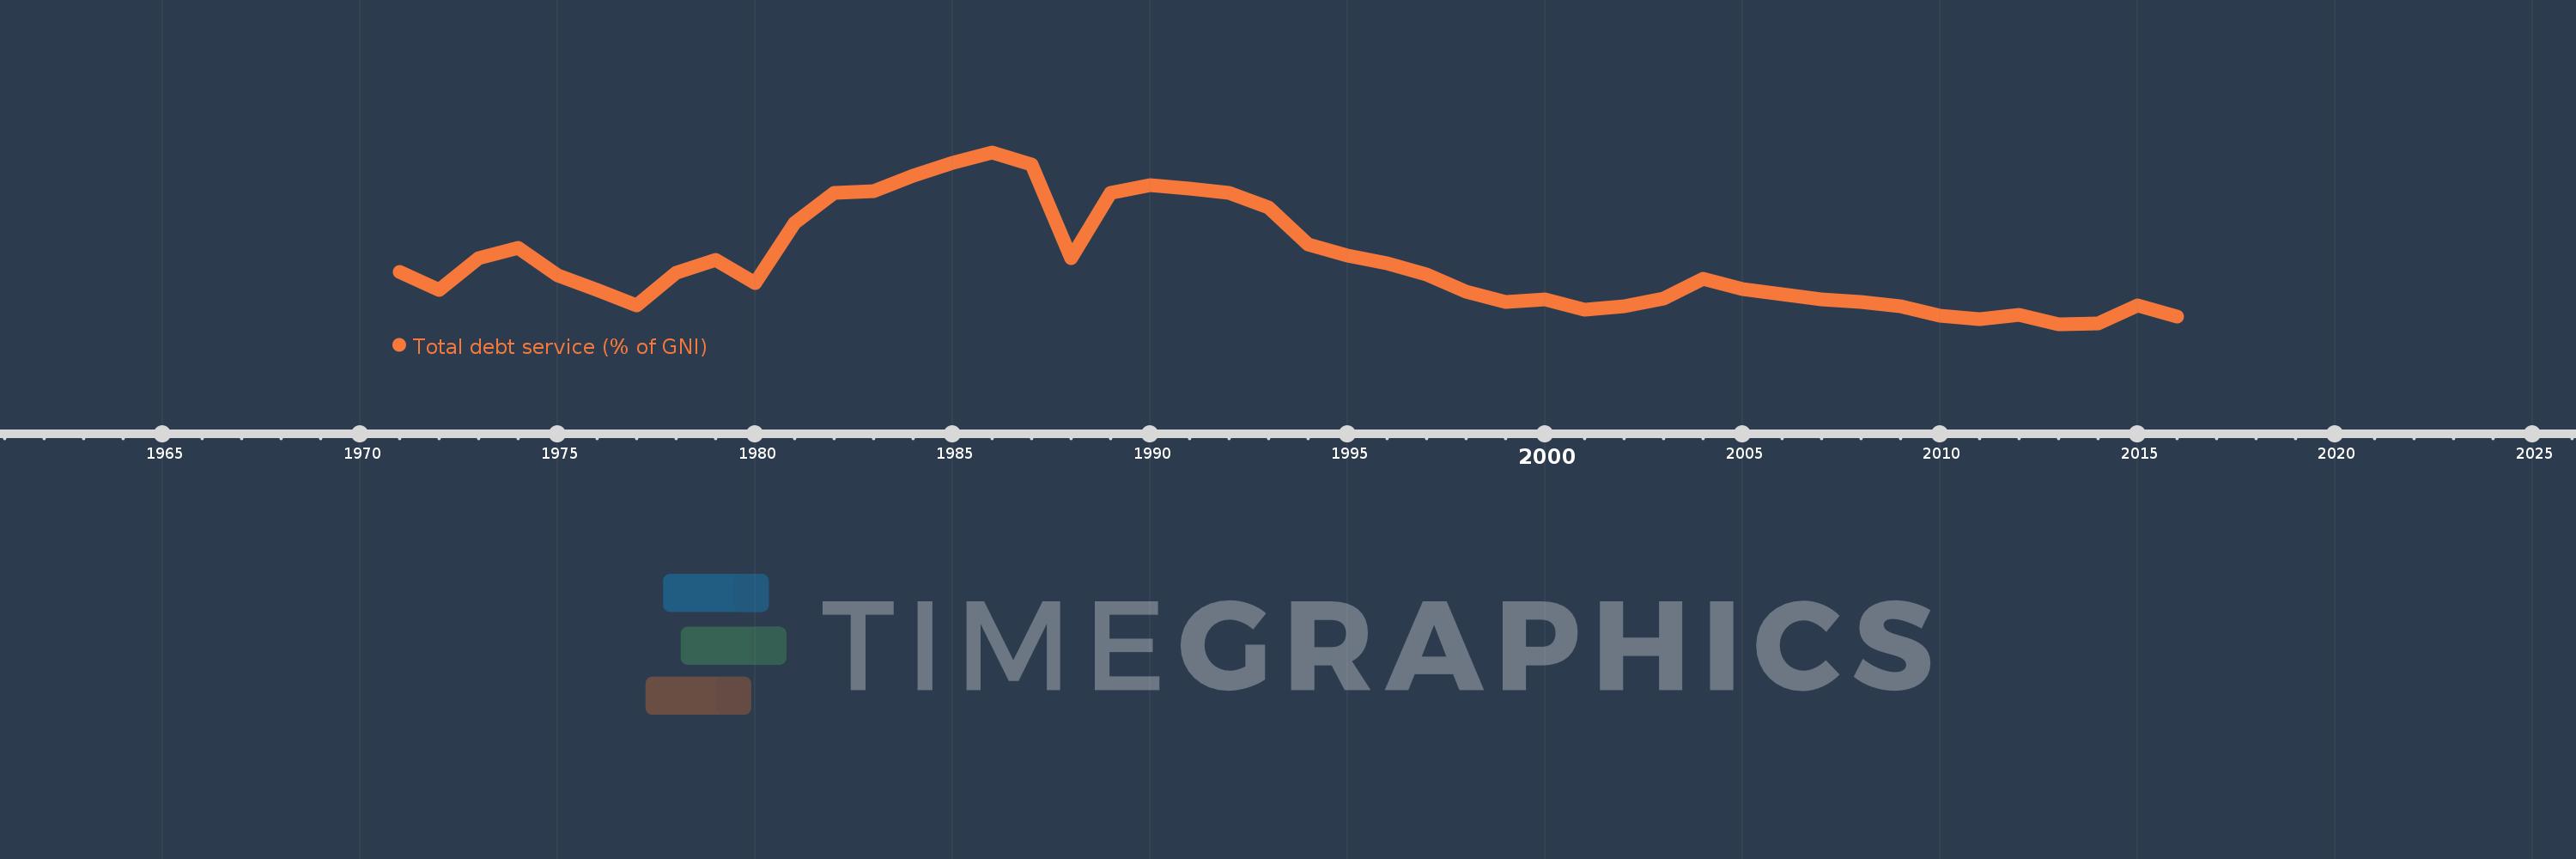
Total debt service (% of GNI)
2016,2015,2014,2013,2012,2011,2010,2009,2008,2007,2006,2005,2004,2003,2002,2001,2000,1999,1998,1997,1996,1995,1994,1993,1992,1991,1990,1989,1988,1987,1986,1985,1984,1983,1982,1981,1980,1979,1978,1977,1976,1975,1974,1973,1972,1971
This statistics in other country:
Timeline:
This timeline shows a graph from 1971 to 2016 of Egypt, Arab Rep.. No data until 1970. Number of actual observations by date: 46.
Source name:
World Development Indicators
Source organization:
World Bank, International Debt Statistics.
Categories, topics:
Economy & Growth, External Debt
Last updated:
apr 23, 2017
Indicators value changes by year
At the date of observation
Value
Absolute change
Change from previous value
jan 1, 1971
3.547
+3.547
0.0%
jan 1, 1972
2.743
-0.805
-22.68%
jan 1, 1973
4.187
+1.444
52.66%
jan 1, 1974
4.654
+0.467
11.16%
jan 1, 1975
3.39
-1.264
-27.16%
jan 1, 1976
2.729
-0.662
-19.52%
jan 1, 1977
2.049
-0.679
-24.9%
jan 1, 1978
3.506
+1.457
71.08%
jan 1, 1979
4.11
+0.604
17.23%
jan 1, 1980
3.036
-1.074
-26.13%
jan 1, 1981
5.758
+2.722
89.67%
jan 1, 1982
7.136
+1.378
23.94%
jan 1, 1983
7.2
+0.064
0.9%
jan 1, 1984
7.918
+0.718
9.97%
jan 1, 1985
8.473
+0.555
7.01%
jan 1, 1986
8.963
+0.49
5.79%
jan 1, 1987
8.43
-0.532
-5.94%
jan 1, 1988
4.155
-4.276
-50.72%
jan 1, 1989
7.143
+2.988
71.92%
jan 1, 1990
7.486
+0.343
4.8%
jan 1, 1991
7.314
-0.172
-2.3%
jan 1, 1992
7.136
-0.178
-2.43%
jan 1, 1993
6.453
-0.683
-9.57%
jan 1, 1994
4.788
-1.665
-25.8%
jan 1, 1995
4.299
-0.489
-10.21%
jan 1, 1996
3.948
-0.35
-8.15%
jan 1, 1997
3.416
-0.533
-13.49%
jan 1, 1998
2.661
-0.755
-22.11%
jan 1, 1999
2.204
-0.456
-17.15%
jan 1, 2000
2.322
+0.118
5.34%
jan 1, 2001
1.826
-0.496
-21.36%
jan 1, 2002
2.014
+0.188
10.28%
jan 1, 2003
2.363
+0.35
17.36%
jan 1, 2004
3.24
+0.876
37.09%
jan 1, 2005
2.762
-0.477
-14.73%
jan 1, 2006
2.555
-0.208
-7.51%
jan 1, 2007
2.301
-0.254
-9.94%
jan 1, 2008
2.196
-0.105
-4.55%
jan 1, 2009
2.004
-0.192
-8.75%
jan 1, 2010
1.568
-0.436
-21.77%
jan 1, 2011
1.412
-0.156
-9.94%
jan 1, 2012
1.61
+0.198
14.02%
jan 1, 2013
1.183
-0.427
-26.53%
jan 1, 2014
1.222
+0.039
3.34%
jan 1, 2015
2.018
+0.796
65.11%
jan 1, 2016
1.546
-0.472
-23.38%
Ranking of countries by current statistics by years


Comments: