29
/
en
AIzaSyAYiBZKx7MnpbEhh9jyipgxe19OcubqV5w
April 1, 2024
111717
Congo, Rep.
COG
true
2
1
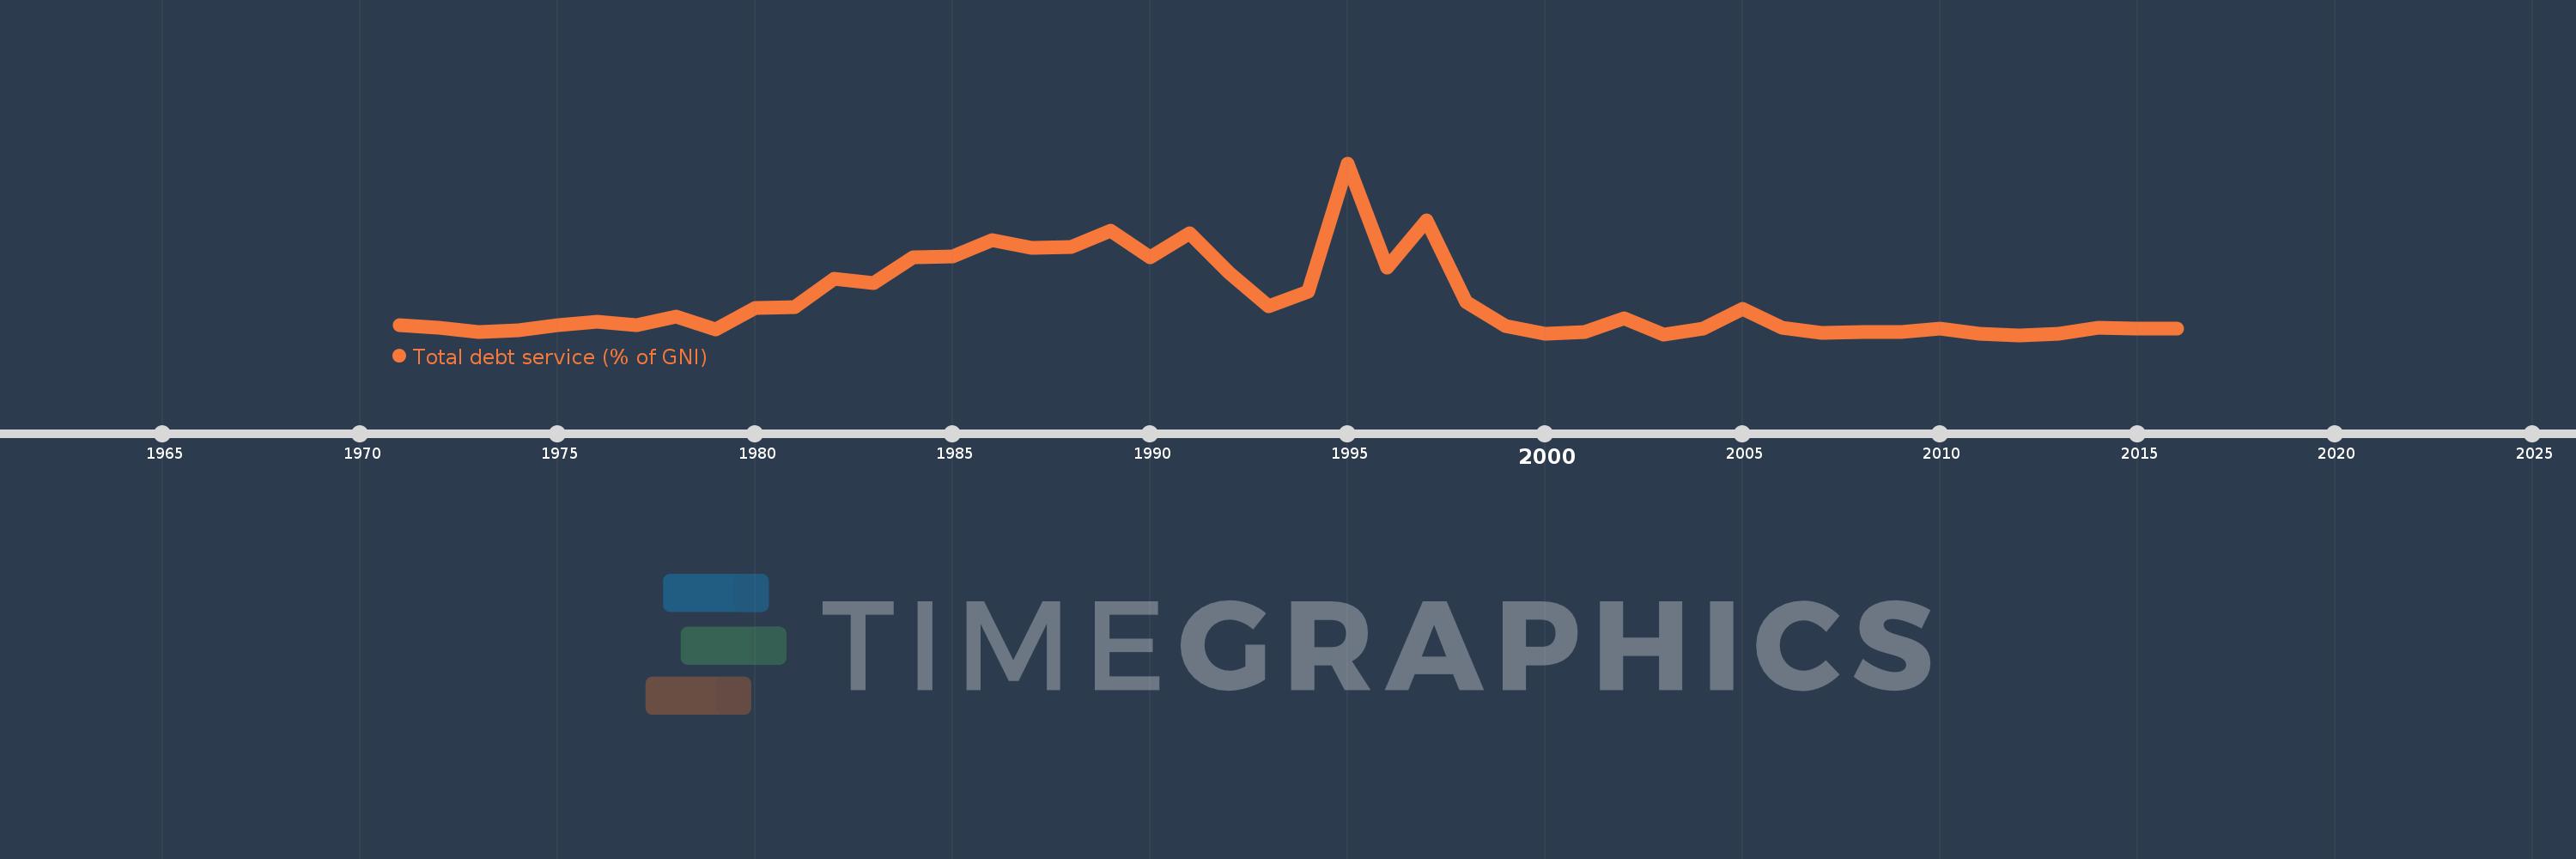
Total debt service (% of GNI)
2016,2015,2014,2013,2012,2011,2010,2009,2008,2007,2006,2005,2004,2003,2002,2001,2000,1999,1998,1997,1996,1995,1994,1993,1992,1991,1990,1989,1988,1987,1986,1985,1984,1983,1982,1981,1980,1979,1978,1977,1976,1975,1974,1973,1972,1971
This statistics in other country:
Timeline:
This timeline shows a graph from 1971 to 2016 of Congo, Rep.. No data until 1970. Number of actual observations by date: 46.
Source name:
World Development Indicators
Source organization:
World Bank, International Debt Statistics.
Categories, topics:
Economy & Growth, External Debt
Last updated:
apr 23, 2017
Indicators value changes by year
Maximum:
36.739
jan 1, 1995
At the date of observation
Value
Absolute change
Change from previous value
jan 1, 1971
3.29
+3.29
0.0%
jan 1, 1972
2.743
-0.547
-16.63%
jan 1, 1973
1.903
-0.84
-30.64%
jan 1, 1974
2.316
+0.414
21.76%
jan 1, 1975
3.234
+0.918
39.62%
jan 1, 1976
3.959
+0.725
22.42%
jan 1, 1977
3.255
-0.705
-17.8%
jan 1, 1978
5.165
+1.911
58.71%
jan 1, 1979
2.479
-2.686
-52.01%
jan 1, 1980
6.865
+4.386
176.93%
jan 1, 1981
7.049
+0.184
2.69%
jan 1, 1982
12.81
+5.761
81.72%
jan 1, 1983
11.916
-0.894
-6.98%
jan 1, 1984
17.279
+5.363
45.0%
jan 1, 1985
17.474
+0.195
1.13%
jan 1, 1986
20.883
+3.409
19.51%
jan 1, 1987
19.267
-1.615
-7.74%
jan 1, 1988
19.362
+0.095
0.49%
jan 1, 1989
22.781
+3.419
17.66%
jan 1, 1990
17.33
-5.451
-23.93%
jan 1, 1991
22.354
+5.024
28.99%
jan 1, 1992
14.127
-8.227
-36.8%
jan 1, 1993
7.241
-6.886
-48.75%
jan 1, 1994
10.241
+3.0
41.44%
jan 1, 1995
36.739
+26.498
258.75%
jan 1, 1996
15.188
-21.55
-58.66%
jan 1, 1997
25.035
+9.846
64.83%
jan 1, 1998
8.173
-16.861
-67.35%
jan 1, 1999
3.091
-5.082
-62.18%
jan 1, 2000
1.624
-1.466
-47.45%
jan 1, 2001
1.98
+0.355
21.88%
jan 1, 2002
4.777
+2.797
141.3%
jan 1, 2003
1.373
-3.404
-71.27%
jan 1, 2004
2.519
+1.146
83.52%
jan 1, 2005
6.713
+4.194
166.5%
jan 1, 2006
2.787
-3.926
-58.48%
jan 1, 2007
1.717
-1.07
-38.38%
jan 1, 2008
1.877
+0.16
9.29%
jan 1, 2009
1.909
+0.032
1.71%
jan 1, 2010
2.559
+0.65
34.06%
jan 1, 2011
1.564
-0.995
-38.87%
jan 1, 2012
1.274
-0.29
-18.53%
jan 1, 2013
1.601
+0.326
25.61%
jan 1, 2014
2.74
+1.139
71.18%
jan 1, 2015
2.587
-0.153
-5.58%
jan 1, 2016
2.673
+0.086
3.32%
Ranking of countries by current statistics by years


Comments: