29
/
en
AIzaSyAYiBZKx7MnpbEhh9jyipgxe19OcubqV5w
April 1, 2024
221653
Paraguay
PRY
true
2
1
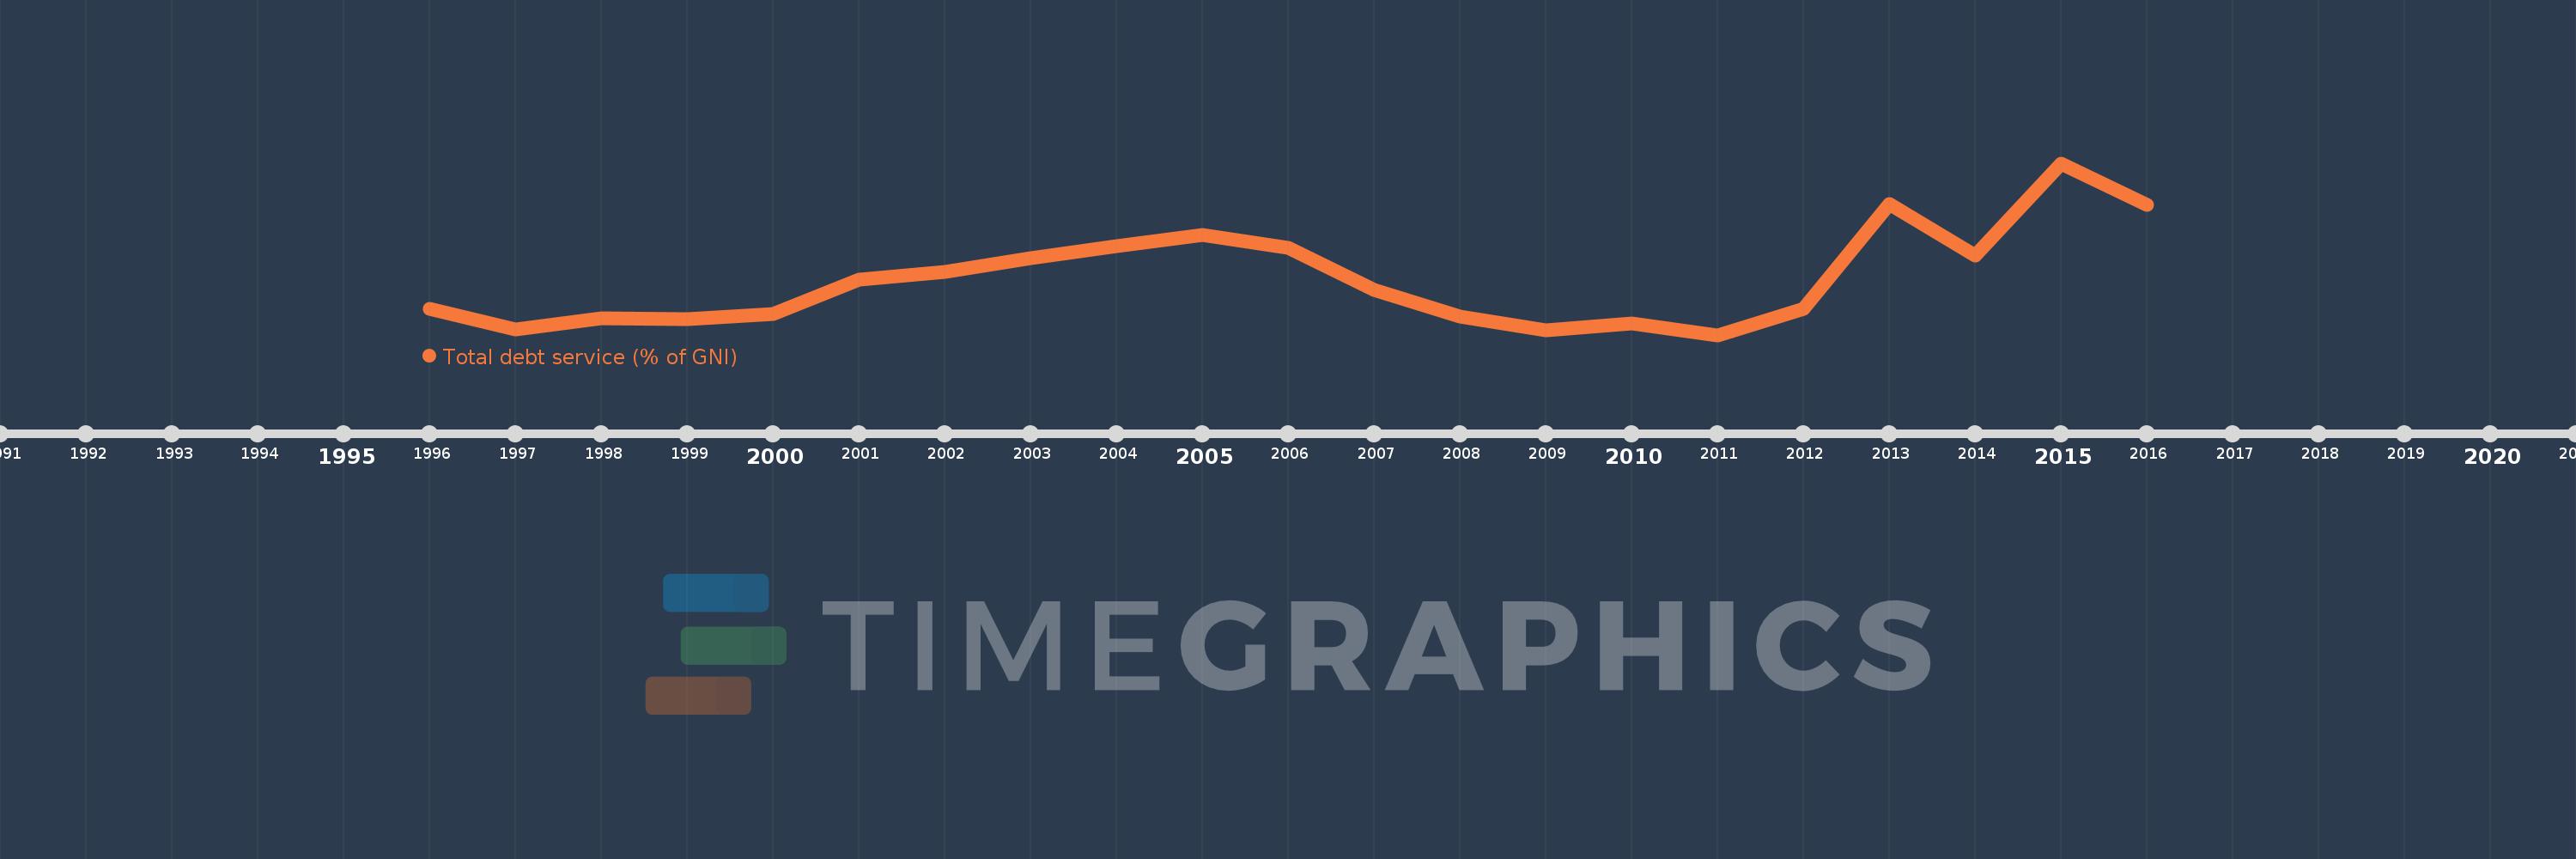
Total debt service (% of GNI)
2016,2015,2014,2013,2012,2011,2010,2009,2008,2007,2006,2005,2004,2003,2002,2001,2000,1999,1998,1997,1996
This statistics in other country:
Timeline:
This timeline shows a graph from 1996 to 2016 of Paraguay. No data until 1995. Number of actual observations by date: 21.
Source name:
World Development Indicators
Source organization:
World Bank, International Debt Statistics.
Categories, topics:
Economy & Growth, External Debt
Last updated:
apr 23, 2017
Indicators value changes by year
Maximum:
10.384
jan 1, 2015
At the date of observation
Value
Absolute change
Change from previous value
jan 1, 1996
3.676
+3.676
0.0%
jan 1, 1997
2.72
-0.956
-26.01%
jan 1, 1998
3.237
+0.517
19.0%
jan 1, 1999
3.183
-0.054
-1.66%
jan 1, 2000
3.412
+0.229
7.19%
jan 1, 2001
5.025
+1.613
47.29%
jan 1, 2002
5.38
+0.355
7.05%
jan 1, 2003
5.995
+0.615
11.43%
jan 1, 2004
6.577
+0.582
9.72%
jan 1, 2005
7.086
+0.509
7.73%
jan 1, 2006
6.478
-0.608
-8.58%
jan 1, 2007
4.521
-1.957
-30.21%
jan 1, 2008
3.318
-1.203
-26.61%
jan 1, 2009
2.655
-0.663
-19.97%
jan 1, 2010
3.007
+0.352
13.25%
jan 1, 2011
2.456
-0.551
-18.33%
jan 1, 2012
3.653
+1.197
48.76%
jan 1, 2013
8.483
+4.83
132.21%
jan 1, 2014
6.107
-2.376
-28.01%
jan 1, 2015
10.384
+4.276
70.02%
jan 1, 2016
8.474
-1.91
-18.4%
Ranking of countries by current statistics by years


Comments: