29
/
en
AIzaSyAYiBZKx7MnpbEhh9jyipgxe19OcubqV5w
April 1, 2024
82930
Belize
BLZ
true
2
1
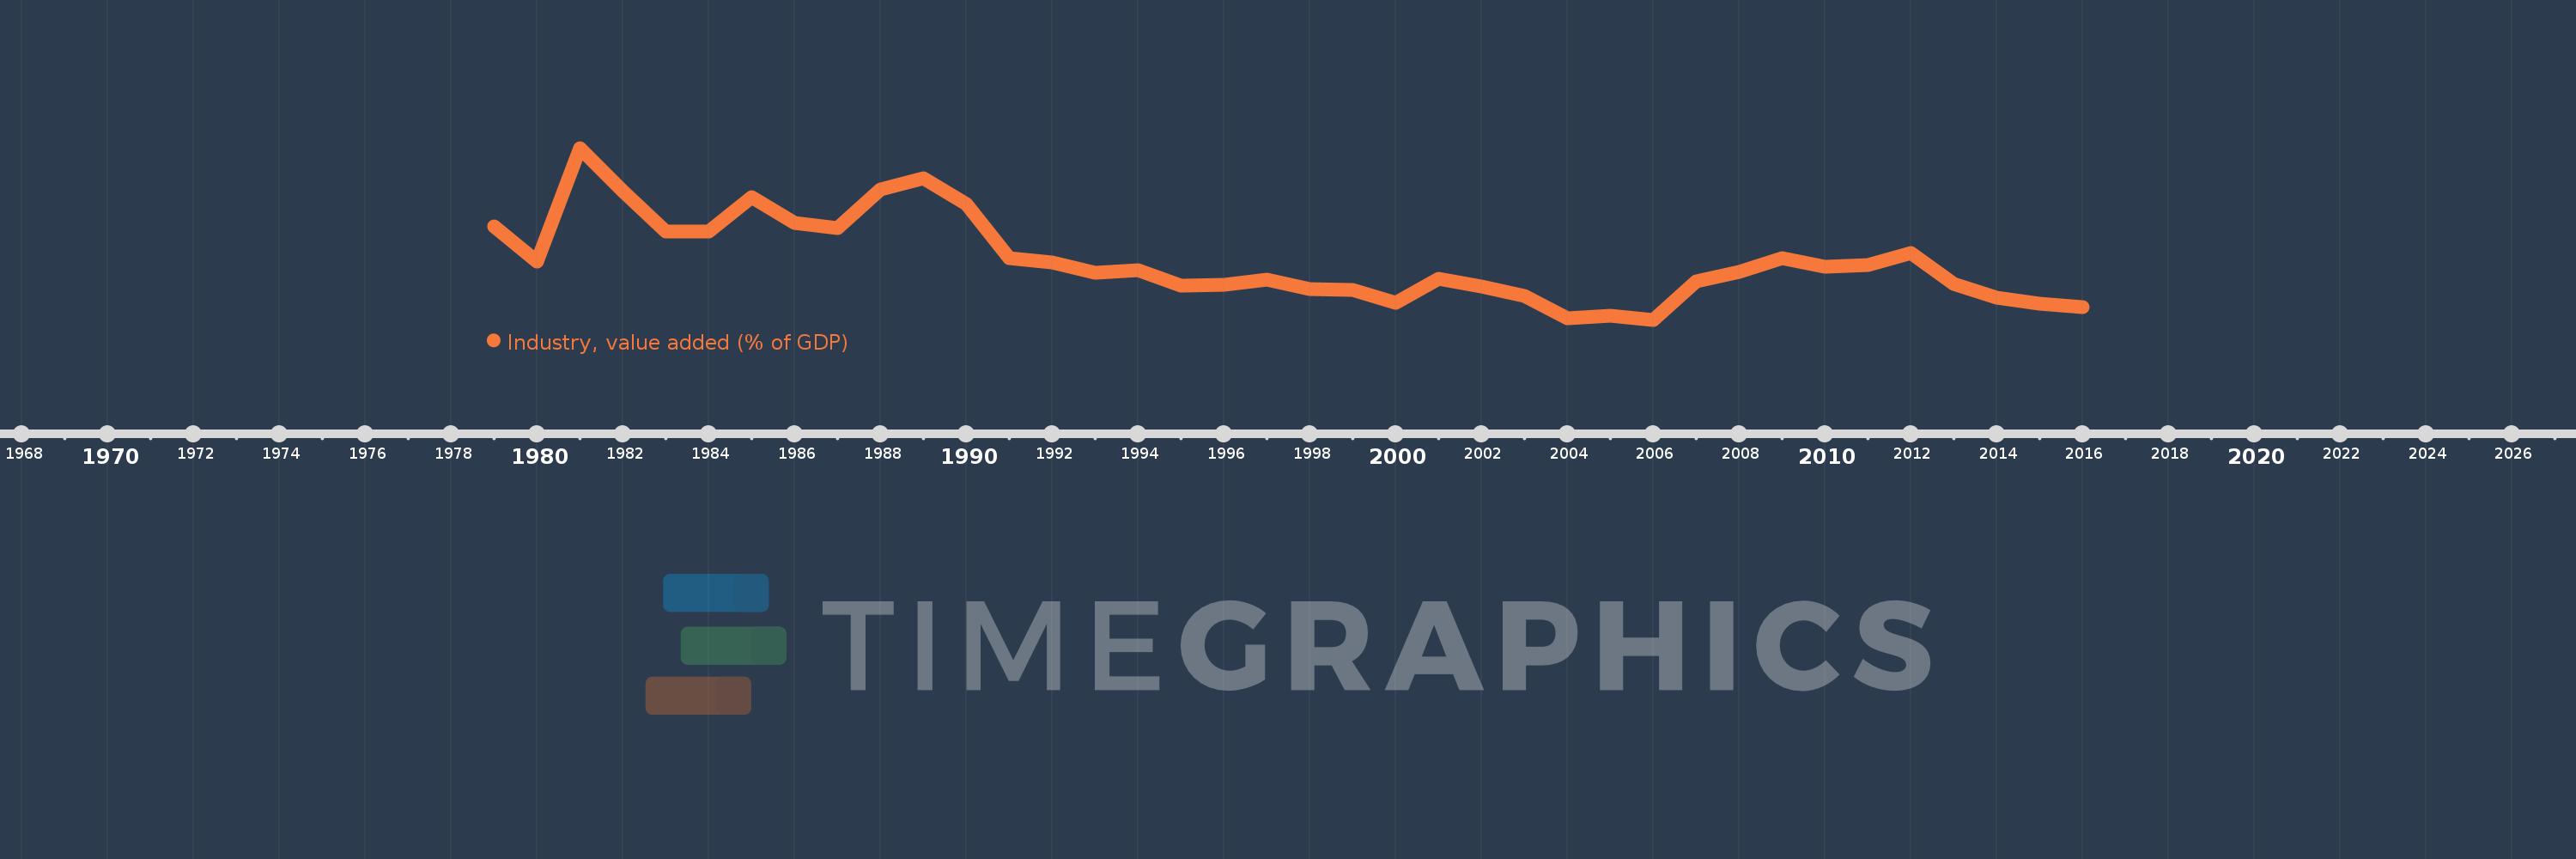
Industry, value added (% of GDP)
2016,2015,2014,2013,2012,2011,2010,2009,2008,2007,2006,2005,2004,2003,2002,2001,2000,1999,1998,1997,1996,1995,1994,1993,1992,1991,1990,1989,1988,1987,1986,1985,1984,1983,1982,1981,1980,1979
This statistics in other country:
AfghanistanAlbaniaAlgeriaAndorraAngolaAntigua and BarbudaArab WorldArgentinaArmeniaArubaAustraliaAustriaAzerbaijanBahamas, TheBahrainBangladeshBarbadosBelarusBelgiumBelizeBeninBermudaBhutanBoliviaBosnia and HerzegovinaBotswanaBrazilBrunei DarussalamBulgariaBurkina FasoBurundiCabo VerdeCambodiaCameroonCanadaCaribbean small statesCayman IslandsCentral African RepublicCentral Europe and the BalticsChadChileChinaColombiaComorosCongo, Dem. Rep.Congo, Rep.Costa RicaCote d'IvoireCroatiaCubaCyprusCzech RepublicDenmarkDjiboutiDominicaDominican RepublicEarly-demographic dividendEast Asia & PacificEast Asia & Pacific (excluding high income)East Asia & Pacific (IDA & IBRD countries)EcuadorEgypt, Arab Rep.El SalvadorEquatorial GuineaEritreaEstoniaEthiopiaEuro areaEurope & Central AsiaEurope & Central Asia (excluding high income)Europe & Central Asia (IDA & IBRD countries)European UnionFijiFinlandFragile and conflict affected situationsFranceGabonGambia, TheGeorgiaGermanyGhanaGreeceGrenadaGuatemalaGuineaGuinea-BissauGuyanaHeavily indebted poor countries (HIPC)High incomeHondurasHong Kong SAR, ChinaHungaryIBRD onlyIcelandIDA & IBRD totalIDA blendIDA onlyIDA totalIndiaIndonesiaIran, Islamic Rep.IrelandItalyJamaicaJapanJordanKazakhstanKenyaKiribatiKorea, Rep.KosovoKuwaitKyrgyz RepublicLao PDRLate-demographic dividendLatin America & Caribbean Latin America & Caribbean (excluding high income)Latin America & the Caribbean (IDA & IBRD countries)LatviaLeast developed countries: UN classificationLebanonLesothoLibyaLiechtensteinLithuaniaLow & middle incomeLow incomeLower middle incomeLuxembourgMacao SAR, ChinaMacedonia, FYRMadagascarMalawiMalaysiaMaldivesMaliMaltaMarshall IslandsMauritaniaMauritiusMexicoMicronesia, Fed. Sts.Middle East & North AfricaMiddle East & North Africa (excluding high income)Middle East & North Africa (IDA & IBRD countries)Middle incomeMoldovaMongoliaMontenegroMoroccoMozambiqueMyanmarNamibiaNepalNetherlandsNew CaledoniaNew ZealandNicaraguaNigerNigeriaNorth AmericaNorwayOECD membersOmanOther small statesPacific island small statesPakistanPalauPanamaPapua New GuineaParaguayPeruPhilippinesPolandPortugalPost-demographic dividendPre-demographic dividendPuerto RicoQatarRomaniaRussian FederationRwandaSao Tome and PrincipeSaudi ArabiaSenegalSerbiaSeychellesSierra LeoneSingaporeSlovak RepublicSloveniaSmall statesSolomon IslandsSomaliaSouth AfricaSouth AsiaSouth Asia (IDA & IBRD)SpainSri LankaSt. Kitts and NevisSt. LuciaSt. Vincent and the GrenadinesSub-Saharan Africa Sub-Saharan Africa (excluding high income)Sub-Saharan Africa (IDA & IBRD countries)SudanSurinameSwazilandSwedenSwitzerlandSyrian Arab RepublicTajikistanTanzaniaThailandTimor-LesteTogoTongaTrinidad and TobagoTunisiaTurkeyTurkmenistanTuvaluUgandaUkraineUnited KingdomUnited StatesUpper middle incomeUruguayUzbekistanVanuatuVenezuela, RBVietnamWest Bank and GazaWorldYemen, Rep.ZambiaZimbabwe Timeline:
This timeline shows a graph from 1979 to 2016 of Belize. No data until 1978. Number of actual observations by date: 38.
Source name:
World Development Indicators
Source organization:
World Bank national accounts data, and OECD National Accounts data files.
Categories, topics:
Economy & Growth
Last updated:
apr 23, 2017
Indicators value changes by year
Maximum:
30.875
jan 1, 1981
At the date of observation
Value
Absolute change
Change from previous value
jan 1, 1979
24.653
+24.653
0.0%
jan 1, 1980
21.921
-2.731
-11.08%
jan 1, 1981
30.875
+8.954
40.85%
jan 1, 1982
27.454
-3.421
-11.08%
jan 1, 1983
24.293
-3.162
-11.52%
jan 1, 1984
24.242
-0.05
-0.21%
jan 1, 1985
26.999
+2.756
11.37%
jan 1, 1986
24.967
-2.031
-7.52%
jan 1, 1987
24.542
-0.425
-1.7%
jan 1, 1988
27.609
+3.067
12.5%
jan 1, 1989
28.458
+0.85
3.08%
jan 1, 1990
26.475
-1.983
-6.97%
jan 1, 1991
22.194
-4.281
-16.17%
jan 1, 1992
21.842
-0.353
-1.59%
jan 1, 1993
21.048
-0.794
-3.63%
jan 1, 1994
21.256
+0.208
0.99%
jan 1, 1995
20.016
-1.239
-5.83%
jan 1, 1996
20.082
+0.065
0.33%
jan 1, 1997
20.491
+0.409
2.04%
jan 1, 1998
19.758
-0.733
-3.58%
jan 1, 1999
19.693
-0.065
-0.33%
jan 1, 2000
18.637
-1.056
-5.36%
jan 1, 2001
20.573
+1.936
10.39%
jan 1, 2002
19.931
-0.642
-3.12%
jan 1, 2003
19.192
-0.739
-3.71%
jan 1, 2004
17.456
-1.736
-9.05%
jan 1, 2005
17.628
+0.172
0.98%
jan 1, 2006
17.31
-0.318
-1.81%
jan 1, 2007
20.373
+3.064
17.7%
jan 1, 2008
21.059
+0.685
3.36%
jan 1, 2009
22.195
+1.136
5.39%
jan 1, 2010
21.489
-0.705
-3.18%
jan 1, 2011
21.662
+0.173
0.8%
jan 1, 2012
22.6
+0.938
4.33%
jan 1, 2013
20.168
-2.432
-10.76%
jan 1, 2014
19.076
-1.092
-5.41%
jan 1, 2015
18.582
-0.495
-2.59%
jan 1, 2016
18.327
-0.255
-1.37%
Ranking of countries by current statistics by years


Comments: