29
/
en
AIzaSyAYiBZKx7MnpbEhh9jyipgxe19OcubqV5w
April 1, 2024
86090
Bhutan
BTN
true
2
1
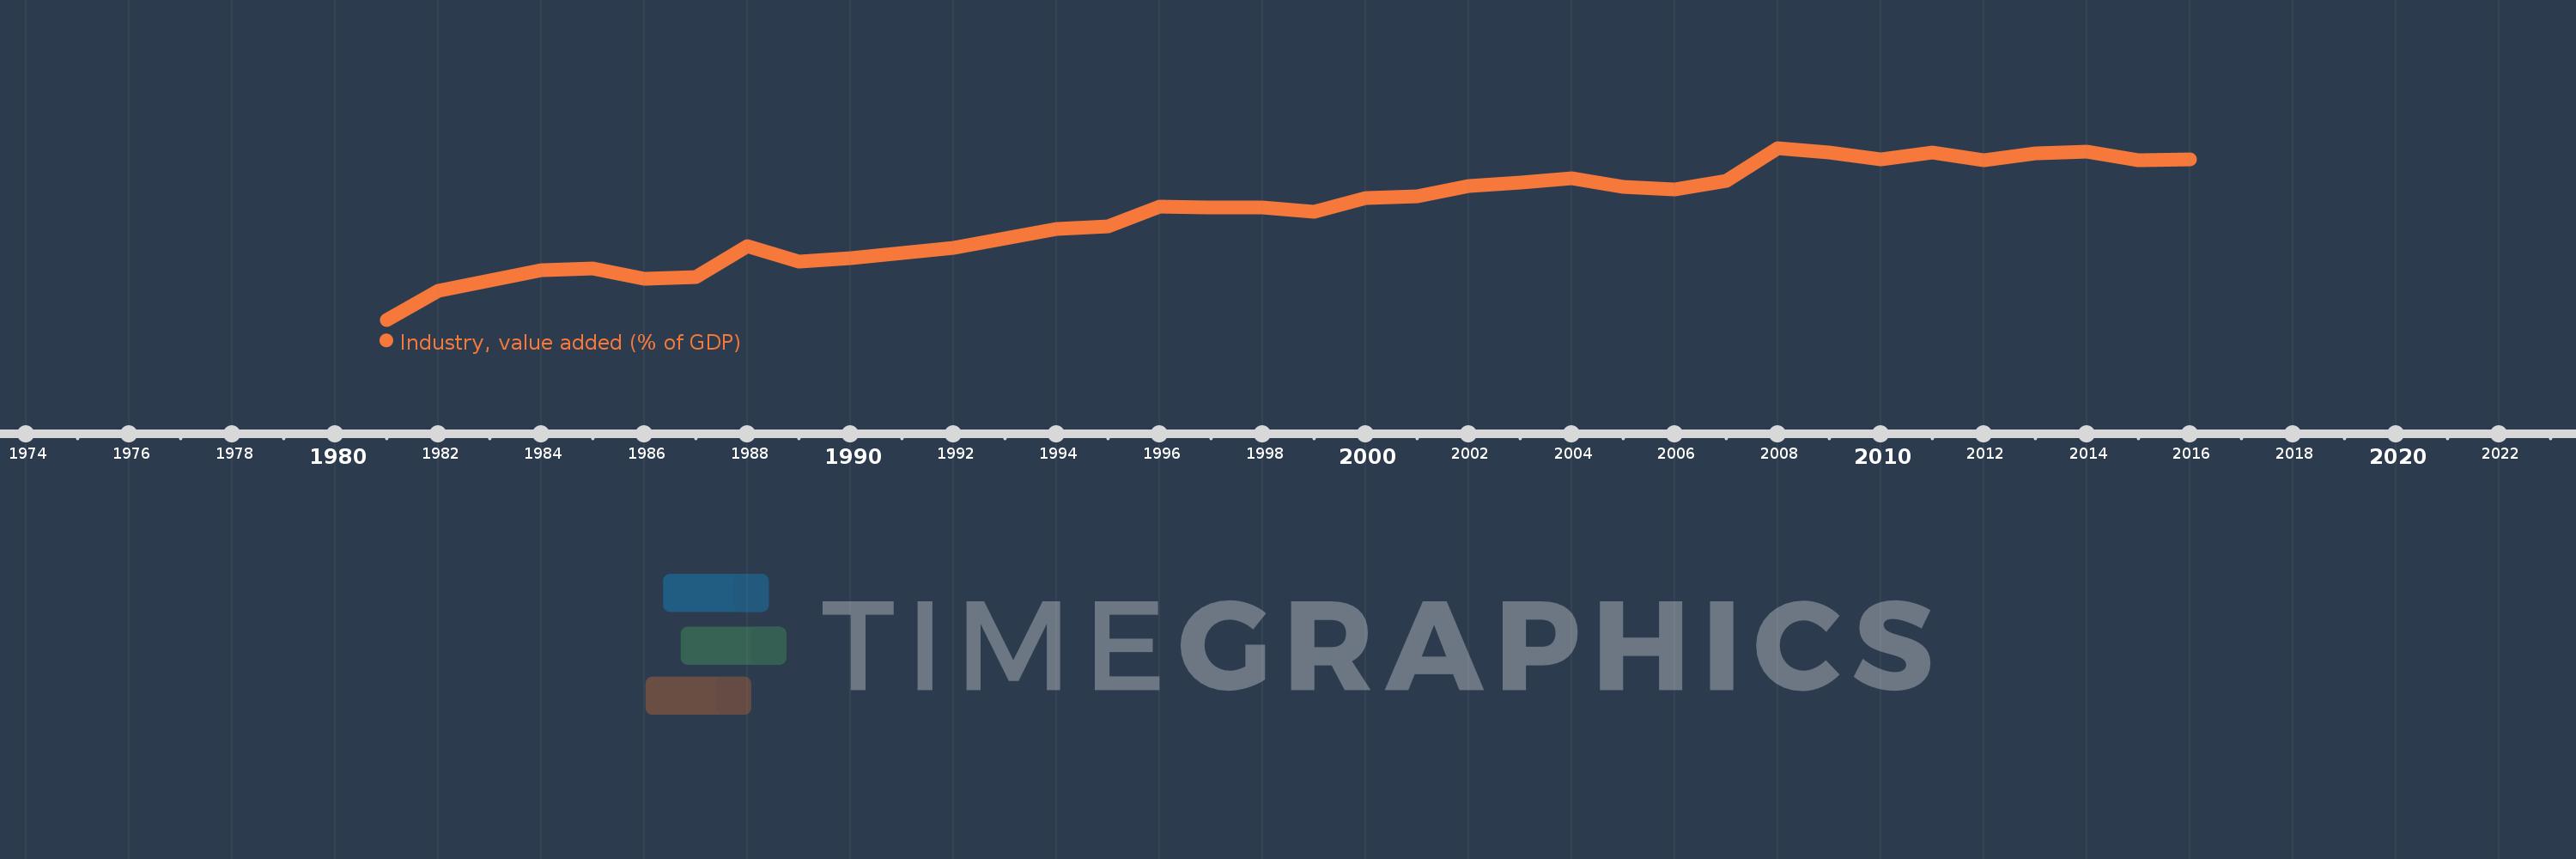
Industry, value added (% of GDP)
2016,2015,2014,2013,2012,2011,2010,2009,2008,2007,2006,2005,2004,2003,2002,2001,2000,1999,1998,1997,1996,1995,1994,1993,1992,1991,1990,1989,1988,1987,1986,1985,1984,1983,1982,1981
This statistics in other country:
AfghanistanAlbaniaAlgeriaAndorraAngolaAntigua and BarbudaArab WorldArgentinaArmeniaArubaAustraliaAustriaAzerbaijanBahamas, TheBahrainBangladeshBarbadosBelarusBelgiumBelizeBeninBermudaBhutanBoliviaBosnia and HerzegovinaBotswanaBrazilBrunei DarussalamBulgariaBurkina FasoBurundiCabo VerdeCambodiaCameroonCanadaCaribbean small statesCayman IslandsCentral African RepublicCentral Europe and the BalticsChadChileChinaColombiaComorosCongo, Dem. Rep.Congo, Rep.Costa RicaCote d'IvoireCroatiaCubaCyprusCzech RepublicDenmarkDjiboutiDominicaDominican RepublicEarly-demographic dividendEast Asia & PacificEast Asia & Pacific (excluding high income)East Asia & Pacific (IDA & IBRD countries)EcuadorEgypt, Arab Rep.El SalvadorEquatorial GuineaEritreaEstoniaEthiopiaEuro areaEurope & Central AsiaEurope & Central Asia (excluding high income)Europe & Central Asia (IDA & IBRD countries)European UnionFijiFinlandFragile and conflict affected situationsFranceGabonGambia, TheGeorgiaGermanyGhanaGreeceGrenadaGuatemalaGuineaGuinea-BissauGuyanaHeavily indebted poor countries (HIPC)High incomeHondurasHong Kong SAR, ChinaHungaryIBRD onlyIcelandIDA & IBRD totalIDA blendIDA onlyIDA totalIndiaIndonesiaIran, Islamic Rep.IrelandItalyJamaicaJapanJordanKazakhstanKenyaKiribatiKorea, Rep.KosovoKuwaitKyrgyz RepublicLao PDRLate-demographic dividendLatin America & Caribbean Latin America & Caribbean (excluding high income)Latin America & the Caribbean (IDA & IBRD countries)LatviaLeast developed countries: UN classificationLebanonLesothoLibyaLiechtensteinLithuaniaLow & middle incomeLow incomeLower middle incomeLuxembourgMacao SAR, ChinaMacedonia, FYRMadagascarMalawiMalaysiaMaldivesMaliMaltaMarshall IslandsMauritaniaMauritiusMexicoMicronesia, Fed. Sts.Middle East & North AfricaMiddle East & North Africa (excluding high income)Middle East & North Africa (IDA & IBRD countries)Middle incomeMoldovaMongoliaMontenegroMoroccoMozambiqueMyanmarNamibiaNepalNetherlandsNew CaledoniaNew ZealandNicaraguaNigerNigeriaNorth AmericaNorwayOECD membersOmanOther small statesPacific island small statesPakistanPalauPanamaPapua New GuineaParaguayPeruPhilippinesPolandPortugalPost-demographic dividendPre-demographic dividendPuerto RicoQatarRomaniaRussian FederationRwandaSao Tome and PrincipeSaudi ArabiaSenegalSerbiaSeychellesSierra LeoneSingaporeSlovak RepublicSloveniaSmall statesSolomon IslandsSomaliaSouth AfricaSouth AsiaSouth Asia (IDA & IBRD)SpainSri LankaSt. Kitts and NevisSt. LuciaSt. Vincent and the GrenadinesSub-Saharan Africa Sub-Saharan Africa (excluding high income)Sub-Saharan Africa (IDA & IBRD countries)SudanSurinameSwazilandSwedenSwitzerlandSyrian Arab RepublicTajikistanTanzaniaThailandTimor-LesteTogoTongaTrinidad and TobagoTunisiaTurkeyTurkmenistanTuvaluUgandaUkraineUnited KingdomUnited StatesUpper middle incomeUruguayUzbekistanVanuatuVenezuela, RBVietnamWest Bank and GazaWorldYemen, Rep.ZambiaZimbabwe Timeline:
This timeline shows a graph from 1981 to 2016 of Bhutan. No data until 1980. Number of actual observations by date: 36.
Source name:
World Development Indicators
Source organization:
World Bank national accounts data, and OECD National Accounts data files.
Categories, topics:
Economy & Growth
Last updated:
apr 23, 2017
Indicators value changes by year
Minimum:
11.746
jan 1, 1981
Maximum:
45.376
jan 1, 2008
At the date of observation
Value
Absolute change
Change from previous value
jan 1, 1981
11.746
+11.746
0.0%
jan 1, 1982
17.431
+5.684
48.39%
jan 1, 1983
19.355
+1.924
11.04%
jan 1, 1984
21.404
+2.049
10.59%
jan 1, 1985
21.78
+0.376
1.76%
jan 1, 1986
19.763
-2.017
-9.26%
jan 1, 1987
20.114
+0.351
1.78%
jan 1, 1988
26.176
+6.063
30.14%
jan 1, 1989
23.071
-3.106
-11.86%
jan 1, 1990
23.809
+0.738
3.2%
jan 1, 1991
24.853
+1.044
4.38%
jan 1, 1992
25.775
+0.922
3.71%
jan 1, 1993
27.675
+1.9
7.37%
jan 1, 1994
29.528
+1.853
6.7%
jan 1, 1995
29.957
+0.429
1.45%
jan 1, 1996
33.857
+3.9
13.02%
jan 1, 1997
33.763
-0.094
-0.28%
jan 1, 1998
33.789
+0.026
0.08%
jan 1, 1999
32.902
-0.887
-2.62%
jan 1, 2000
35.645
+2.743
8.34%
jan 1, 2001
35.991
+0.345
0.97%
jan 1, 2002
37.908
+1.918
5.33%
jan 1, 2003
38.601
+0.692
1.83%
jan 1, 2004
39.365
+0.765
1.98%
jan 1, 2005
37.743
-1.622
-4.12%
jan 1, 2006
37.289
-0.454
-1.2%
jan 1, 2007
38.986
+1.696
4.55%
jan 1, 2008
45.376
+6.39
16.39%
jan 1, 2009
44.51
-0.866
-1.91%
jan 1, 2010
43.168
-1.342
-3.02%
jan 1, 2011
44.558
+1.39
3.22%
jan 1, 2012
42.967
-1.591
-3.57%
jan 1, 2013
44.258
+1.291
3.01%
jan 1, 2014
44.681
+0.423
0.96%
jan 1, 2015
42.89
-1.791
-4.01%
jan 1, 2016
43.212
+0.322
0.75%
Ranking of countries by current statistics by years


Comments: