29
/
en
AIzaSyAYiBZKx7MnpbEhh9jyipgxe19OcubqV5w
April 1, 2024
262394
Thailand
THA
true
2
1
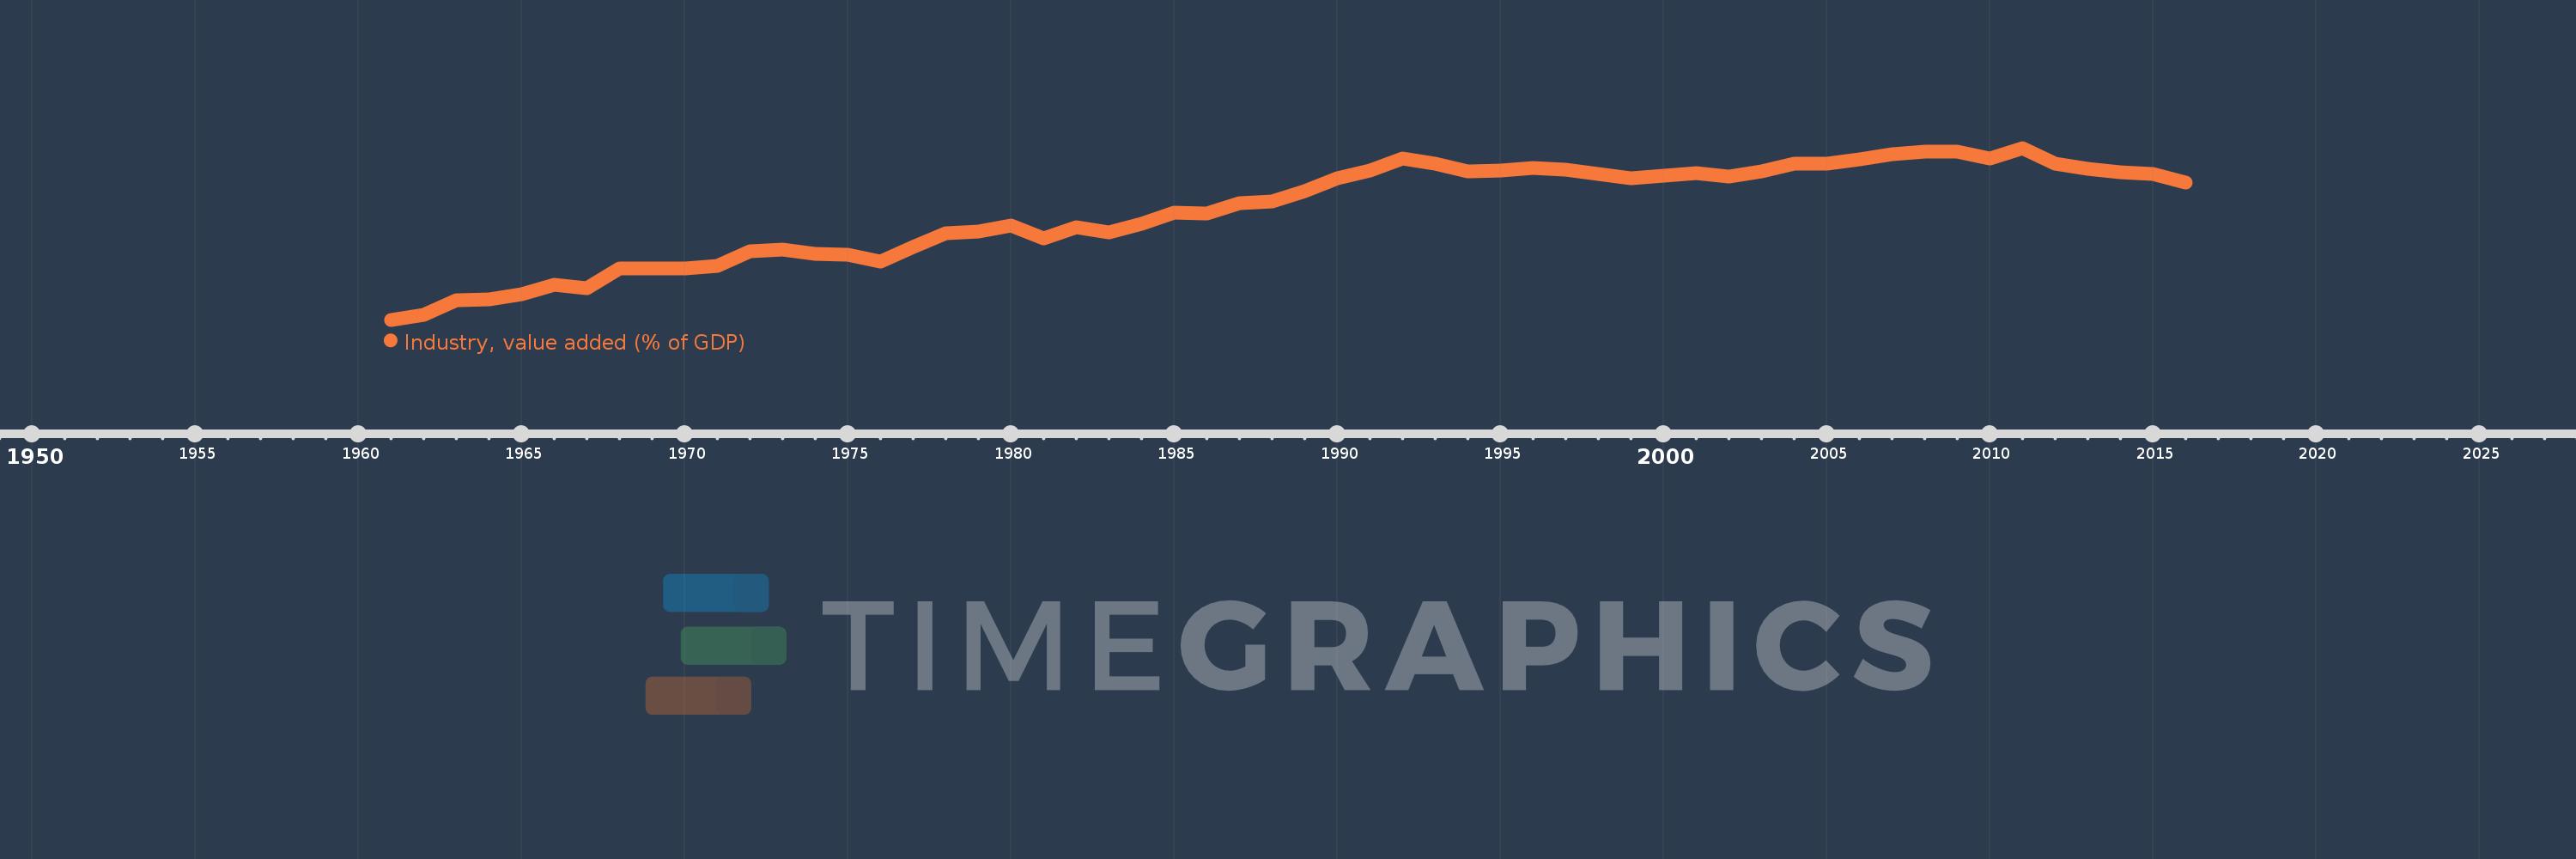
Industry, value added (% of GDP)
2016,2015,2014,2013,2012,2011,2010,2009,2008,2007,2006,2005,2004,2003,2002,2001,2000,1999,1998,1997,1996,1995,1994,1993,1992,1991,1990,1989,1988,1987,1986,1985,1984,1983,1982,1981,1980,1979,1978,1977,1976,1975,1974,1973,1972,1971,1970,1969,1968,1967,1966,1965,1964,1963,1962,1961
This statistics in other country:
AfghanistanAlbaniaAlgeriaAndorraAngolaAntigua and BarbudaArab WorldArgentinaArmeniaArubaAustraliaAustriaAzerbaijanBahamas, TheBahrainBangladeshBarbadosBelarusBelgiumBelizeBeninBermudaBhutanBoliviaBosnia and HerzegovinaBotswanaBrazilBrunei DarussalamBulgariaBurkina FasoBurundiCabo VerdeCambodiaCameroonCanadaCaribbean small statesCayman IslandsCentral African RepublicCentral Europe and the BalticsChadChileChinaColombiaComorosCongo, Dem. Rep.Congo, Rep.Costa RicaCote d'IvoireCroatiaCubaCyprusCzech RepublicDenmarkDjiboutiDominicaDominican RepublicEarly-demographic dividendEast Asia & PacificEast Asia & Pacific (excluding high income)East Asia & Pacific (IDA & IBRD countries)EcuadorEgypt, Arab Rep.El SalvadorEquatorial GuineaEritreaEstoniaEthiopiaEuro areaEurope & Central AsiaEurope & Central Asia (excluding high income)Europe & Central Asia (IDA & IBRD countries)European UnionFijiFinlandFragile and conflict affected situationsFranceGabonGambia, TheGeorgiaGermanyGhanaGreeceGrenadaGuatemalaGuineaGuinea-BissauGuyanaHeavily indebted poor countries (HIPC)High incomeHondurasHong Kong SAR, ChinaHungaryIBRD onlyIcelandIDA & IBRD totalIDA blendIDA onlyIDA totalIndiaIndonesiaIran, Islamic Rep.IrelandItalyJamaicaJapanJordanKazakhstanKenyaKiribatiKorea, Rep.KosovoKuwaitKyrgyz RepublicLao PDRLate-demographic dividendLatin America & Caribbean Latin America & Caribbean (excluding high income)Latin America & the Caribbean (IDA & IBRD countries)LatviaLeast developed countries: UN classificationLebanonLesothoLibyaLiechtensteinLithuaniaLow & middle incomeLow incomeLower middle incomeLuxembourgMacao SAR, ChinaMacedonia, FYRMadagascarMalawiMalaysiaMaldivesMaliMaltaMarshall IslandsMauritaniaMauritiusMexicoMicronesia, Fed. Sts.Middle East & North AfricaMiddle East & North Africa (excluding high income)Middle East & North Africa (IDA & IBRD countries)Middle incomeMoldovaMongoliaMontenegroMoroccoMozambiqueMyanmarNamibiaNepalNetherlandsNew CaledoniaNew ZealandNicaraguaNigerNigeriaNorth AmericaNorwayOECD membersOmanOther small statesPacific island small statesPakistanPalauPanamaPapua New GuineaParaguayPeruPhilippinesPolandPortugalPost-demographic dividendPre-demographic dividendPuerto RicoQatarRomaniaRussian FederationRwandaSao Tome and PrincipeSaudi ArabiaSenegalSerbiaSeychellesSierra LeoneSingaporeSlovak RepublicSloveniaSmall statesSolomon IslandsSomaliaSouth AfricaSouth AsiaSouth Asia (IDA & IBRD)SpainSri LankaSt. Kitts and NevisSt. LuciaSt. Vincent and the GrenadinesSub-Saharan Africa Sub-Saharan Africa (excluding high income)Sub-Saharan Africa (IDA & IBRD countries)SudanSurinameSwazilandSwedenSwitzerlandSyrian Arab RepublicTajikistanTanzaniaThailandTimor-LesteTogoTongaTrinidad and TobagoTunisiaTurkeyTurkmenistanTuvaluUgandaUkraineUnited KingdomUnited StatesUpper middle incomeUruguayUzbekistanVanuatuVenezuela, RBVietnamWest Bank and GazaWorldYemen, Rep.ZambiaZimbabwe Timeline:
This timeline shows a graph from 1961 to 2016 of Thailand. No data until 1960. Number of actual observations by date: 56.
Source name:
World Development Indicators
Source organization:
World Bank national accounts data, and OECD National Accounts data files.
Categories, topics:
Economy & Growth
Last updated:
apr 23, 2017
Indicators value changes by year
Minimum:
18.516
jan 1, 1961
Maximum:
40.034
jan 1, 2011
At the date of observation
Value
Absolute change
Change from previous value
jan 1, 1961
18.516
+18.516
0.0%
jan 1, 1962
19.165
+0.648
3.5%
jan 1, 1963
20.943
+1.778
9.28%
jan 1, 1964
21.027
+0.084
0.4%
jan 1, 1965
21.7
+0.673
3.2%
jan 1, 1966
22.885
+1.185
5.46%
jan 1, 1967
22.506
-0.38
-1.66%
jan 1, 1968
24.957
+2.452
10.89%
jan 1, 1969
24.906
-0.052
-0.21%
jan 1, 1970
24.937
+0.031
0.12%
jan 1, 1971
25.305
+0.369
1.48%
jan 1, 1972
27.053
+1.748
6.91%
jan 1, 1973
27.278
+0.225
0.83%
jan 1, 1974
26.79
-0.488
-1.79%
jan 1, 1975
26.648
-0.142
-0.53%
jan 1, 1976
25.783
-0.865
-3.24%
jan 1, 1977
27.619
+1.836
7.12%
jan 1, 1978
29.343
+1.724
6.24%
jan 1, 1979
29.558
+0.214
0.73%
jan 1, 1980
30.345
+0.788
2.67%
jan 1, 1981
28.678
-1.667
-5.49%
jan 1, 1982
30.099
+1.421
4.96%
jan 1, 1983
29.51
-0.589
-1.96%
jan 1, 1984
30.583
+1.073
3.64%
jan 1, 1985
31.975
+1.392
4.55%
jan 1, 1986
31.843
-0.133
-0.41%
jan 1, 1987
33.083
+1.24
3.89%
jan 1, 1988
33.343
+0.26
0.79%
jan 1, 1989
34.58
+1.237
3.71%
jan 1, 1990
36.252
+1.672
4.83%
jan 1, 1991
37.225
+0.973
2.68%
jan 1, 1992
38.658
+1.433
3.85%
jan 1, 1993
38.056
-0.602
-1.56%
jan 1, 1994
37.079
-0.977
-2.57%
jan 1, 1995
37.223
+0.144
0.39%
jan 1, 1996
37.526
+0.303
0.81%
jan 1, 1997
37.322
-0.205
-0.55%
jan 1, 1998
36.784
-0.538
-1.44%
jan 1, 1999
36.285
-0.499
-1.36%
jan 1, 2000
36.548
+0.263
0.73%
jan 1, 2001
36.84
+0.292
0.8%
jan 1, 2002
36.467
-0.372
-1.01%
jan 1, 2003
37.045
+0.578
1.58%
jan 1, 2004
38.058
+1.013
2.73%
jan 1, 2005
38.028
-0.03
-0.08%
jan 1, 2006
38.629
+0.601
1.58%
jan 1, 2007
39.27
+0.641
1.66%
jan 1, 2008
39.546
+0.276
0.7%
jan 1, 2009
39.585
+0.039
0.1%
jan 1, 2010
38.726
-0.859
-2.17%
jan 1, 2011
40.034
+1.308
3.38%
jan 1, 2012
38.094
-1.94
-4.85%
jan 1, 2013
37.453
-0.641
-1.68%
jan 1, 2014
36.979
-0.474
-1.27%
jan 1, 2015
36.774
-0.205
-0.56%
jan 1, 2016
35.717
-1.056
-2.87%
Ranking of countries by current statistics by years


Comments: