29
/
en
AIzaSyAYiBZKx7MnpbEhh9jyipgxe19OcubqV5w
April 1, 2024
209442
New Zealand
NZL
true
2
1
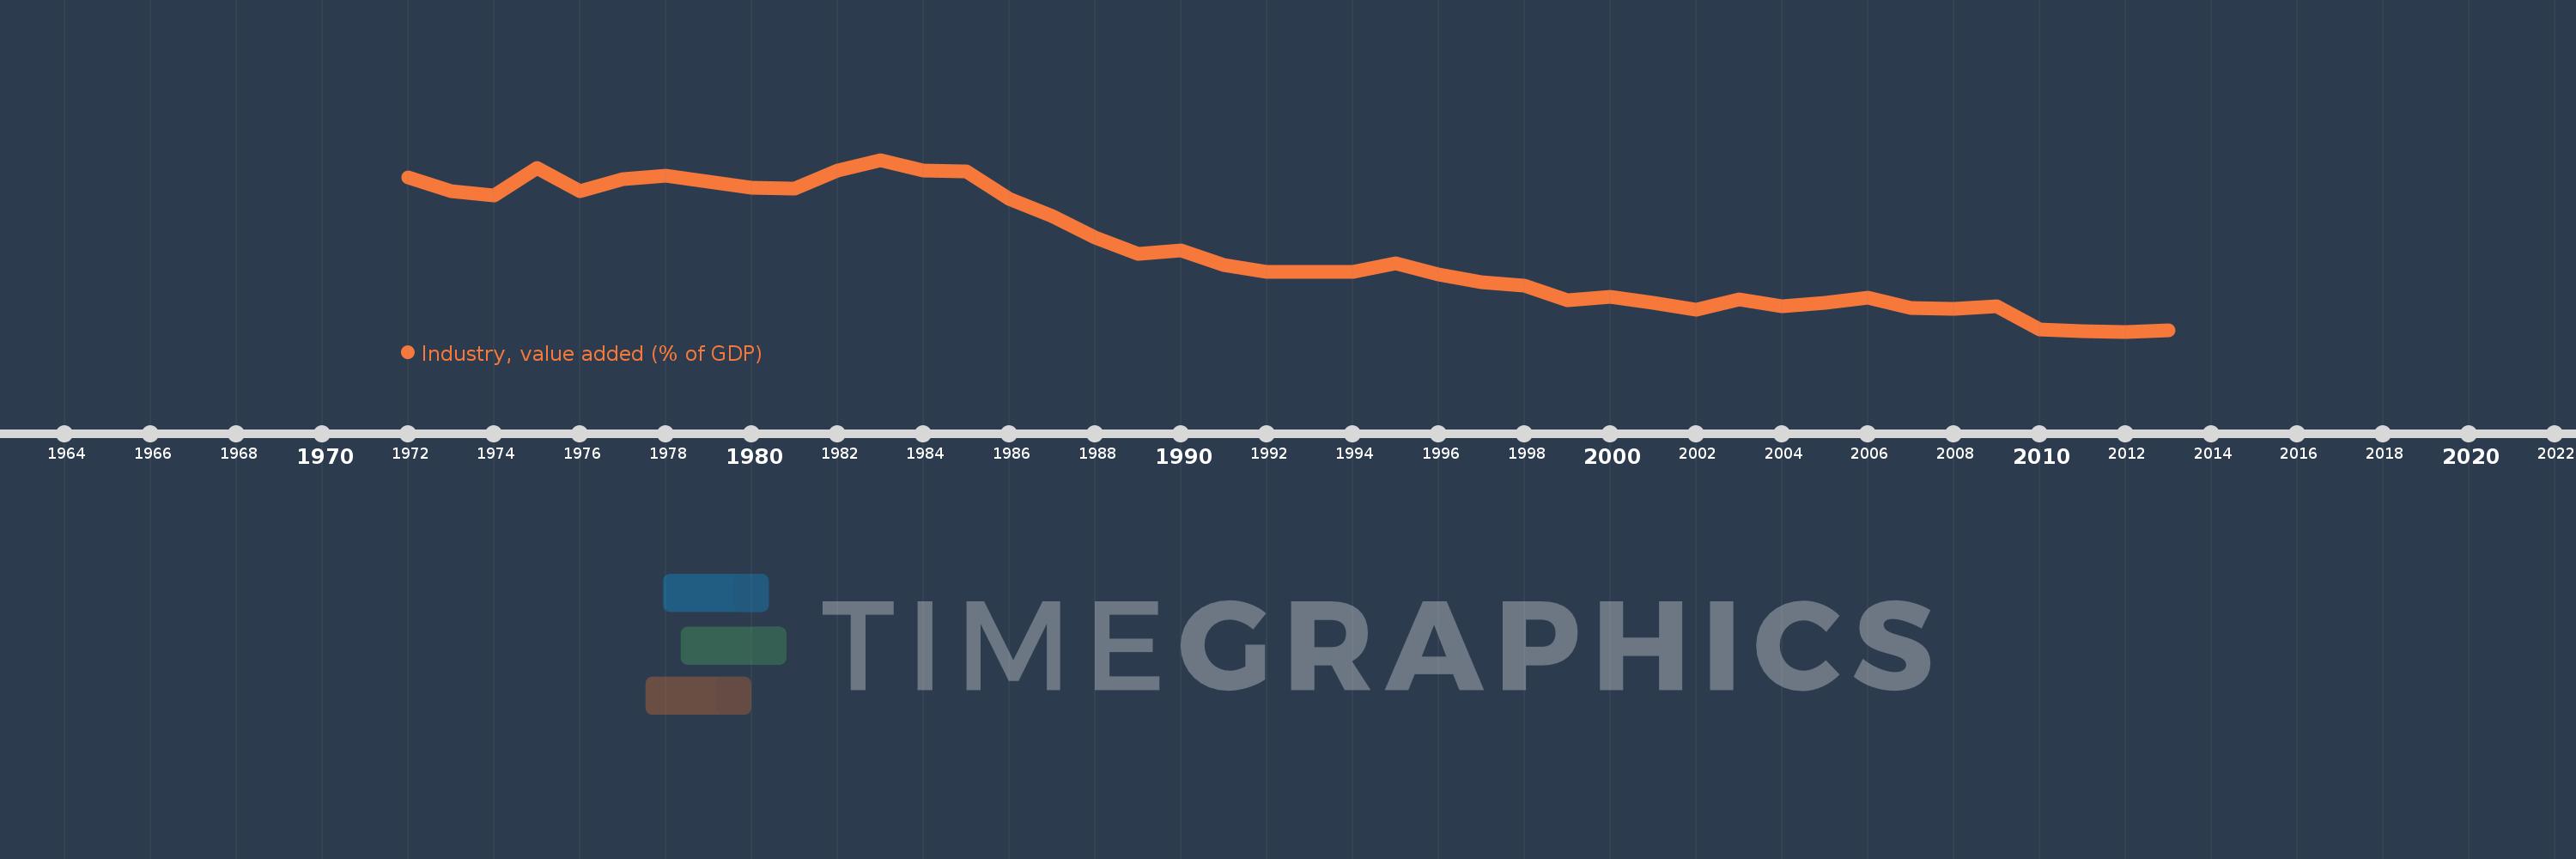
Industry, value added (% of GDP)
2013,2012,2011,2010,2009,2008,2007,2006,2005,2004,2003,2002,2001,2000,1999,1998,1997,1996,1995,1994,1993,1992,1991,1990,1989,1988,1987,1986,1985,1984,1983,1982,1981,1980,1979,1978,1977,1976,1975,1974,1973,1972
This statistics in other country:
AfghanistanAlbaniaAlgeriaAndorraAngolaAntigua and BarbudaArab WorldArgentinaArmeniaArubaAustraliaAustriaAzerbaijanBahamas, TheBahrainBangladeshBarbadosBelarusBelgiumBelizeBeninBermudaBhutanBoliviaBosnia and HerzegovinaBotswanaBrazilBrunei DarussalamBulgariaBurkina FasoBurundiCabo VerdeCambodiaCameroonCanadaCaribbean small statesCayman IslandsCentral African RepublicCentral Europe and the BalticsChadChileChinaColombiaComorosCongo, Dem. Rep.Congo, Rep.Costa RicaCote d'IvoireCroatiaCubaCyprusCzech RepublicDenmarkDjiboutiDominicaDominican RepublicEarly-demographic dividendEast Asia & PacificEast Asia & Pacific (excluding high income)East Asia & Pacific (IDA & IBRD countries)EcuadorEgypt, Arab Rep.El SalvadorEquatorial GuineaEritreaEstoniaEthiopiaEuro areaEurope & Central AsiaEurope & Central Asia (excluding high income)Europe & Central Asia (IDA & IBRD countries)European UnionFijiFinlandFragile and conflict affected situationsFranceGabonGambia, TheGeorgiaGermanyGhanaGreeceGrenadaGuatemalaGuineaGuinea-BissauGuyanaHeavily indebted poor countries (HIPC)High incomeHondurasHong Kong SAR, ChinaHungaryIBRD onlyIcelandIDA & IBRD totalIDA blendIDA onlyIDA totalIndiaIndonesiaIran, Islamic Rep.IrelandItalyJamaicaJapanJordanKazakhstanKenyaKiribatiKorea, Rep.KosovoKuwaitKyrgyz RepublicLao PDRLate-demographic dividendLatin America & Caribbean Latin America & Caribbean (excluding high income)Latin America & the Caribbean (IDA & IBRD countries)LatviaLeast developed countries: UN classificationLebanonLesothoLibyaLiechtensteinLithuaniaLow & middle incomeLow incomeLower middle incomeLuxembourgMacao SAR, ChinaMacedonia, FYRMadagascarMalawiMalaysiaMaldivesMaliMaltaMarshall IslandsMauritaniaMauritiusMexicoMicronesia, Fed. Sts.Middle East & North AfricaMiddle East & North Africa (excluding high income)Middle East & North Africa (IDA & IBRD countries)Middle incomeMoldovaMongoliaMontenegroMoroccoMozambiqueMyanmarNamibiaNepalNetherlandsNew CaledoniaNew ZealandNicaraguaNigerNigeriaNorth AmericaNorwayOECD membersOmanOther small statesPacific island small statesPakistanPalauPanamaPapua New GuineaParaguayPeruPhilippinesPolandPortugalPost-demographic dividendPre-demographic dividendPuerto RicoQatarRomaniaRussian FederationRwandaSao Tome and PrincipeSaudi ArabiaSenegalSerbiaSeychellesSierra LeoneSingaporeSlovak RepublicSloveniaSmall statesSolomon IslandsSomaliaSouth AfricaSouth AsiaSouth Asia (IDA & IBRD)SpainSri LankaSt. Kitts and NevisSt. LuciaSt. Vincent and the GrenadinesSub-Saharan Africa Sub-Saharan Africa (excluding high income)Sub-Saharan Africa (IDA & IBRD countries)SudanSurinameSwazilandSwedenSwitzerlandSyrian Arab RepublicTajikistanTanzaniaThailandTimor-LesteTogoTongaTrinidad and TobagoTunisiaTurkeyTurkmenistanTuvaluUgandaUkraineUnited KingdomUnited StatesUpper middle incomeUruguayUzbekistanVanuatuVenezuela, RBVietnamWest Bank and GazaWorldYemen, Rep.ZambiaZimbabwe Timeline:
This timeline shows a graph from 1972 to 2013 of New Zealand. No data until 1971. Number of actual observations by date: 42.
Source name:
World Development Indicators
Source organization:
World Bank national accounts data, and OECD National Accounts data files.
Categories, topics:
Economy & Growth
Last updated:
apr 23, 2017
Indicators value changes by year
Minimum:
22.936
jan 1, 2012
Maximum:
37.406
jan 1, 1983
At the date of observation
Value
Absolute change
Change from previous value
jan 1, 1972
35.928
+35.928
0.0%
jan 1, 1973
34.788
-1.141
-3.18%
jan 1, 1974
34.412
-0.376
-1.08%
jan 1, 1975
36.711
+2.299
6.68%
jan 1, 1976
34.798
-1.913
-5.21%
jan 1, 1977
35.765
+0.967
2.78%
jan 1, 1978
36.074
+0.309
0.87%
jan 1, 1979
35.544
-0.531
-1.47%
jan 1, 1980
35.044
-0.499
-1.4%
jan 1, 1981
34.976
-0.068
-0.19%
jan 1, 1982
36.519
+1.542
4.41%
jan 1, 1983
37.406
+0.887
2.43%
jan 1, 1984
36.496
-0.909
-2.43%
jan 1, 1985
36.419
-0.077
-0.21%
jan 1, 1986
34.141
-2.279
-6.26%
jan 1, 1987
32.67
-1.471
-4.31%
jan 1, 1988
30.878
-1.792
-5.48%
jan 1, 1989
29.506
-1.372
-4.44%
jan 1, 1990
29.771
+0.266
0.9%
jan 1, 1991
28.576
-1.196
-4.02%
jan 1, 1992
27.96
-0.616
-2.15%
jan 1, 1993
27.935
-0.025
-0.09%
jan 1, 1994
27.936
+0.001
0.0%
jan 1, 1995
28.653
+0.717
2.57%
jan 1, 1996
27.777
-0.876
-3.06%
jan 1, 1997
27.082
-0.694
-2.5%
jan 1, 1998
26.775
-0.307
-1.13%
jan 1, 1999
25.596
-1.179
-4.4%
jan 1, 2000
25.858
+0.263
1.03%
jan 1, 2001
25.324
-0.535
-2.07%
jan 1, 2002
24.793
-0.53
-2.09%
jan 1, 2003
25.677
+0.883
3.56%
jan 1, 2004
25.037
-0.639
-2.49%
jan 1, 2005
25.377
+0.34
1.36%
jan 1, 2006
25.809
+0.431
1.7%
jan 1, 2007
24.894
-0.914
-3.54%
jan 1, 2008
24.825
-0.069
-0.28%
jan 1, 2009
25.077
+0.252
1.02%
jan 1, 2010
23.117
-1.96
-7.82%
jan 1, 2011
23.001
-0.116
-0.5%
jan 1, 2012
22.936
-0.064
-0.28%
jan 1, 2013
23.009
+0.072
0.32%
Ranking of countries by current statistics by years


Comments: