29
/
en
AIzaSyAYiBZKx7MnpbEhh9jyipgxe19OcubqV5w
April 1, 2024
226844
Puerto Rico
PRI
true
2
1
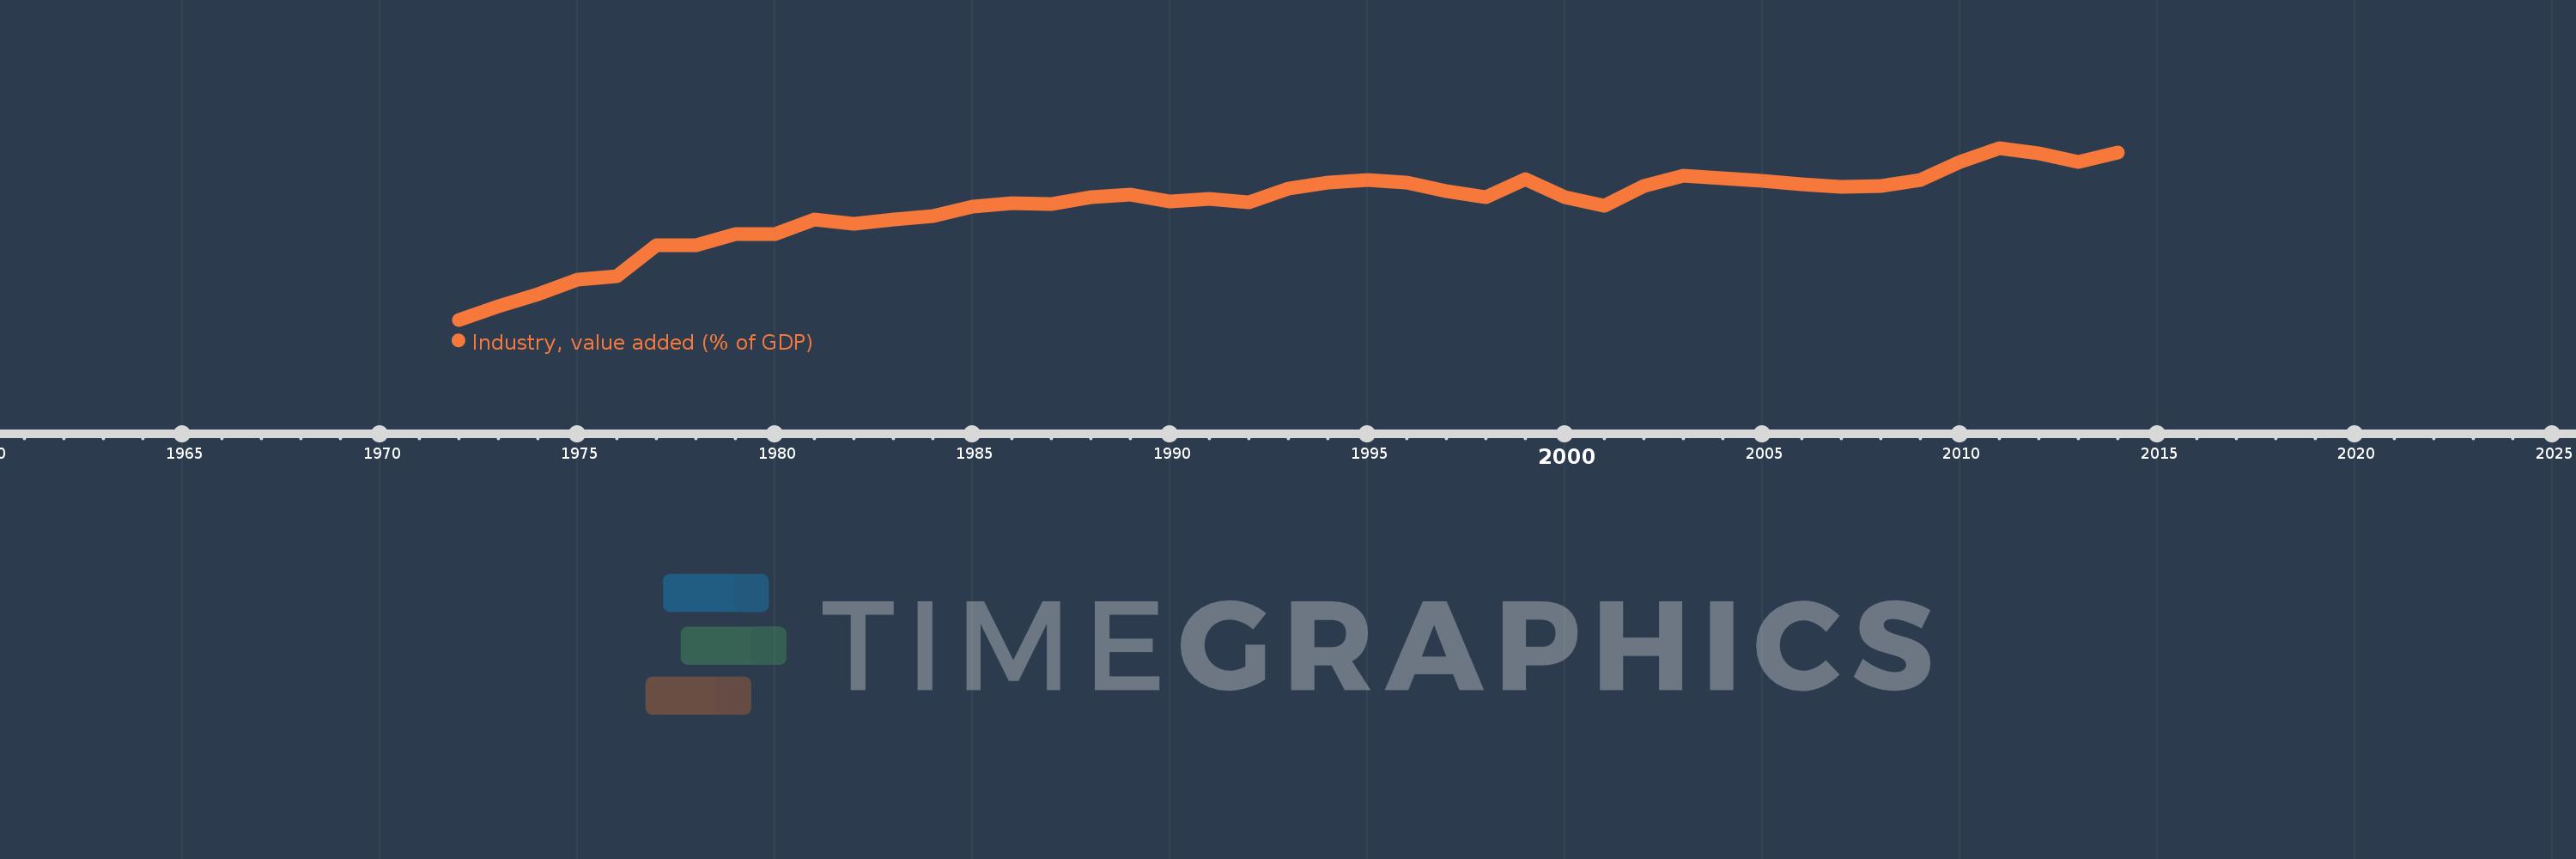
Industry, value added (% of GDP)
2014,2013,2012,2011,2010,2009,2008,2007,2006,2005,2004,2003,2002,2001,2000,1999,1998,1997,1996,1995,1994,1993,1992,1991,1990,1989,1988,1987,1986,1985,1984,1983,1982,1981,1980,1979,1978,1977,1976,1975,1974,1973,1972
This statistics in other country:
AfghanistanAlbaniaAlgeriaAndorraAngolaAntigua and BarbudaArab WorldArgentinaArmeniaArubaAustraliaAustriaAzerbaijanBahamas, TheBahrainBangladeshBarbadosBelarusBelgiumBelizeBeninBermudaBhutanBoliviaBosnia and HerzegovinaBotswanaBrazilBrunei DarussalamBulgariaBurkina FasoBurundiCabo VerdeCambodiaCameroonCanadaCaribbean small statesCayman IslandsCentral African RepublicCentral Europe and the BalticsChadChileChinaColombiaComorosCongo, Dem. Rep.Congo, Rep.Costa RicaCote d'IvoireCroatiaCubaCyprusCzech RepublicDenmarkDjiboutiDominicaDominican RepublicEarly-demographic dividendEast Asia & PacificEast Asia & Pacific (excluding high income)East Asia & Pacific (IDA & IBRD countries)EcuadorEgypt, Arab Rep.El SalvadorEquatorial GuineaEritreaEstoniaEthiopiaEuro areaEurope & Central AsiaEurope & Central Asia (excluding high income)Europe & Central Asia (IDA & IBRD countries)European UnionFijiFinlandFragile and conflict affected situationsFranceGabonGambia, TheGeorgiaGermanyGhanaGreeceGrenadaGuatemalaGuineaGuinea-BissauGuyanaHeavily indebted poor countries (HIPC)High incomeHondurasHong Kong SAR, ChinaHungaryIBRD onlyIcelandIDA & IBRD totalIDA blendIDA onlyIDA totalIndiaIndonesiaIran, Islamic Rep.IrelandItalyJamaicaJapanJordanKazakhstanKenyaKiribatiKorea, Rep.KosovoKuwaitKyrgyz RepublicLao PDRLate-demographic dividendLatin America & Caribbean Latin America & Caribbean (excluding high income)Latin America & the Caribbean (IDA & IBRD countries)LatviaLeast developed countries: UN classificationLebanonLesothoLibyaLiechtensteinLithuaniaLow & middle incomeLow incomeLower middle incomeLuxembourgMacao SAR, ChinaMacedonia, FYRMadagascarMalawiMalaysiaMaldivesMaliMaltaMarshall IslandsMauritaniaMauritiusMexicoMicronesia, Fed. Sts.Middle East & North AfricaMiddle East & North Africa (excluding high income)Middle East & North Africa (IDA & IBRD countries)Middle incomeMoldovaMongoliaMontenegroMoroccoMozambiqueMyanmarNamibiaNepalNetherlandsNew CaledoniaNew ZealandNicaraguaNigerNigeriaNorth AmericaNorwayOECD membersOmanOther small statesPacific island small statesPakistanPalauPanamaPapua New GuineaParaguayPeruPhilippinesPolandPortugalPost-demographic dividendPre-demographic dividendPuerto RicoQatarRomaniaRussian FederationRwandaSao Tome and PrincipeSaudi ArabiaSenegalSerbiaSeychellesSierra LeoneSingaporeSlovak RepublicSloveniaSmall statesSolomon IslandsSomaliaSouth AfricaSouth AsiaSouth Asia (IDA & IBRD)SpainSri LankaSt. Kitts and NevisSt. LuciaSt. Vincent and the GrenadinesSub-Saharan Africa Sub-Saharan Africa (excluding high income)Sub-Saharan Africa (IDA & IBRD countries)SudanSurinameSwazilandSwedenSwitzerlandSyrian Arab RepublicTajikistanTanzaniaThailandTimor-LesteTogoTongaTrinidad and TobagoTunisiaTurkeyTurkmenistanTuvaluUgandaUkraineUnited KingdomUnited StatesUpper middle incomeUruguayUzbekistanVanuatuVenezuela, RBVietnamWest Bank and GazaWorldYemen, Rep.ZambiaZimbabwe Timeline:
This timeline shows a graph from 1972 to 2014 of Puerto Rico. No data until 1971. Number of actual observations by date: 43.
Source name:
World Development Indicators
Source organization:
World Bank national accounts data, and OECD National Accounts data files.
Categories, topics:
Economy & Growth
Last updated:
apr 23, 2017
Indicators value changes by year
Maximum:
96.736
jan 1, 2011
At the date of observation
Value
Absolute change
Change from previous value
jan 1, 1972
51.46
+51.46
0.0%
jan 1, 1973
54.979
+3.519
6.84%
jan 1, 1974
58.187
+3.208
5.84%
jan 1, 1975
61.984
+3.797
6.52%
jan 1, 1976
62.969
+0.985
1.59%
jan 1, 1977
71.104
+8.135
12.92%
jan 1, 1978
71.001
-0.103
-0.15%
jan 1, 1979
74.09
+3.089
4.35%
jan 1, 1980
73.919
-0.171
-0.23%
jan 1, 1981
77.895
+3.976
5.38%
jan 1, 1982
76.726
-1.169
-1.5%
jan 1, 1983
77.869
+1.143
1.49%
jan 1, 1984
78.81
+0.941
1.21%
jan 1, 1985
81.327
+2.516
3.19%
jan 1, 1986
82.112
+0.785
0.97%
jan 1, 1987
81.988
-0.123
-0.15%
jan 1, 1988
83.7
+1.712
2.09%
jan 1, 1989
84.43
+0.73
0.87%
jan 1, 1990
82.721
-1.71
-2.02%
jan 1, 1991
83.245
+0.524
0.63%
jan 1, 1992
82.41
-0.835
-1.0%
jan 1, 1993
85.973
+3.563
4.32%
jan 1, 1994
87.642
+1.67
1.94%
jan 1, 1995
88.285
+0.643
0.73%
jan 1, 1996
87.517
-0.768
-0.87%
jan 1, 1997
85.288
-2.229
-2.55%
jan 1, 1998
83.822
-1.465
-1.72%
jan 1, 1999
88.587
+4.765
5.68%
jan 1, 2000
83.849
-4.738
-5.35%
jan 1, 2001
81.546
-2.303
-2.75%
jan 1, 2002
86.607
+5.061
6.21%
jan 1, 2003
89.407
+2.8
3.23%
jan 1, 2004
88.696
-0.711
-0.8%
jan 1, 2005
87.957
-0.739
-0.83%
jan 1, 2006
87.131
-0.826
-0.94%
jan 1, 2007
86.569
-0.562
-0.65%
jan 1, 2008
86.624
+0.055
0.06%
jan 1, 2009
88.256
+1.632
1.88%
jan 1, 2010
93.123
+4.867
5.52%
jan 1, 2011
96.736
+3.613
3.88%
jan 1, 2012
95.371
-1.365
-1.41%
jan 1, 2013
93.108
-2.263
-2.37%
jan 1, 2014
95.487
+2.379
2.55%
Ranking of countries by current statistics by years


Comments: