29
/
en
AIzaSyAYiBZKx7MnpbEhh9jyipgxe19OcubqV5w
April 1, 2024
223711
Philippines
PHL
true
2
1
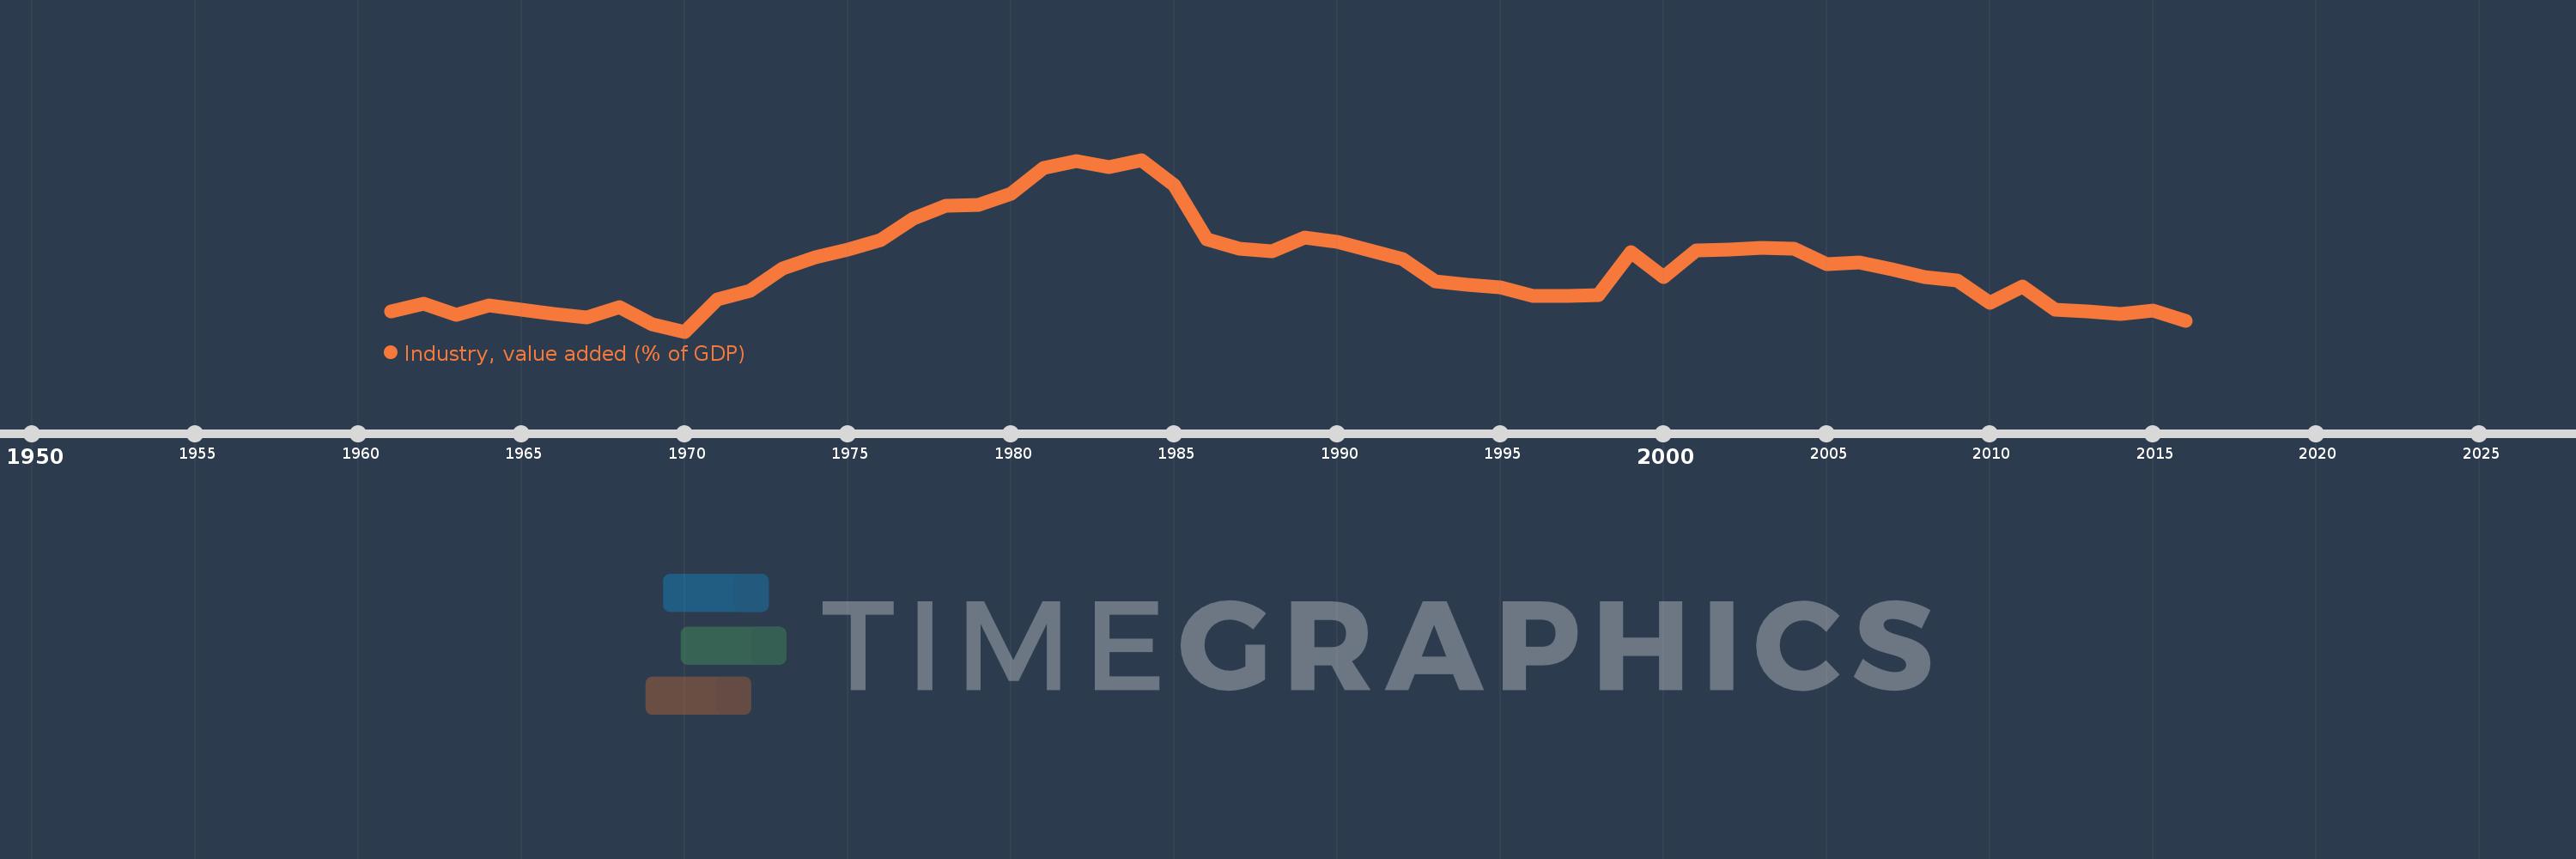
Industry, value added (% of GDP)
2016,2015,2014,2013,2012,2011,2010,2009,2008,2007,2006,2005,2004,2003,2002,2001,2000,1999,1998,1997,1996,1995,1994,1993,1992,1991,1990,1989,1988,1987,1986,1985,1984,1983,1982,1981,1980,1979,1978,1977,1976,1975,1974,1973,1972,1971,1970,1969,1968,1967,1966,1965,1964,1963,1962,1961
This statistics in other country:
AfghanistanAlbaniaAlgeriaAndorraAngolaAntigua and BarbudaArab WorldArgentinaArmeniaArubaAustraliaAustriaAzerbaijanBahamas, TheBahrainBangladeshBarbadosBelarusBelgiumBelizeBeninBermudaBhutanBoliviaBosnia and HerzegovinaBotswanaBrazilBrunei DarussalamBulgariaBurkina FasoBurundiCabo VerdeCambodiaCameroonCanadaCaribbean small statesCayman IslandsCentral African RepublicCentral Europe and the BalticsChadChileChinaColombiaComorosCongo, Dem. Rep.Congo, Rep.Costa RicaCote d'IvoireCroatiaCubaCyprusCzech RepublicDenmarkDjiboutiDominicaDominican RepublicEarly-demographic dividendEast Asia & PacificEast Asia & Pacific (excluding high income)East Asia & Pacific (IDA & IBRD countries)EcuadorEgypt, Arab Rep.El SalvadorEquatorial GuineaEritreaEstoniaEthiopiaEuro areaEurope & Central AsiaEurope & Central Asia (excluding high income)Europe & Central Asia (IDA & IBRD countries)European UnionFijiFinlandFragile and conflict affected situationsFranceGabonGambia, TheGeorgiaGermanyGhanaGreeceGrenadaGuatemalaGuineaGuinea-BissauGuyanaHeavily indebted poor countries (HIPC)High incomeHondurasHong Kong SAR, ChinaHungaryIBRD onlyIcelandIDA & IBRD totalIDA blendIDA onlyIDA totalIndiaIndonesiaIran, Islamic Rep.IrelandItalyJamaicaJapanJordanKazakhstanKenyaKiribatiKorea, Rep.KosovoKuwaitKyrgyz RepublicLao PDRLate-demographic dividendLatin America & Caribbean Latin America & Caribbean (excluding high income)Latin America & the Caribbean (IDA & IBRD countries)LatviaLeast developed countries: UN classificationLebanonLesothoLibyaLiechtensteinLithuaniaLow & middle incomeLow incomeLower middle incomeLuxembourgMacao SAR, ChinaMacedonia, FYRMadagascarMalawiMalaysiaMaldivesMaliMaltaMarshall IslandsMauritaniaMauritiusMexicoMicronesia, Fed. Sts.Middle East & North AfricaMiddle East & North Africa (excluding high income)Middle East & North Africa (IDA & IBRD countries)Middle incomeMoldovaMongoliaMontenegroMoroccoMozambiqueMyanmarNamibiaNepalNetherlandsNew CaledoniaNew ZealandNicaraguaNigerNigeriaNorth AmericaNorwayOECD membersOmanOther small statesPacific island small statesPakistanPalauPanamaPapua New GuineaParaguayPeruPhilippinesPolandPortugalPost-demographic dividendPre-demographic dividendPuerto RicoQatarRomaniaRussian FederationRwandaSao Tome and PrincipeSaudi ArabiaSenegalSerbiaSeychellesSierra LeoneSingaporeSlovak RepublicSloveniaSmall statesSolomon IslandsSomaliaSouth AfricaSouth AsiaSouth Asia (IDA & IBRD)SpainSri LankaSt. Kitts and NevisSt. LuciaSt. Vincent and the GrenadinesSub-Saharan Africa Sub-Saharan Africa (excluding high income)Sub-Saharan Africa (IDA & IBRD countries)SudanSurinameSwazilandSwedenSwitzerlandSyrian Arab RepublicTajikistanTanzaniaThailandTimor-LesteTogoTongaTrinidad and TobagoTunisiaTurkeyTurkmenistanTuvaluUgandaUkraineUnited KingdomUnited StatesUpper middle incomeUruguayUzbekistanVanuatuVenezuela, RBVietnamWest Bank and GazaWorldYemen, Rep.ZambiaZimbabwe Timeline:
This timeline shows a graph from 1961 to 2016 of Philippines. No data until 1960. Number of actual observations by date: 56.
Source name:
World Development Indicators
Source organization:
World Bank national accounts data, and OECD National Accounts data files.
Categories, topics:
Economy & Growth
Last updated:
apr 23, 2017
Indicators value changes by year
Minimum:
30.201
jan 1, 1970
Maximum:
39.233
jan 1, 1984
At the date of observation
Value
Absolute change
Change from previous value
jan 1, 1961
31.268
+31.268
0.0%
jan 1, 1962
31.649
+0.38
1.22%
jan 1, 1963
31.079
-0.569
-1.8%
jan 1, 1964
31.573
+0.494
1.59%
jan 1, 1965
31.332
-0.242
-0.77%
jan 1, 1966
31.109
-0.222
-0.71%
jan 1, 1967
30.943
-0.166
-0.53%
jan 1, 1968
31.504
+0.561
1.81%
jan 1, 1969
30.598
-0.906
-2.88%
jan 1, 1970
30.201
-0.397
-1.3%
jan 1, 1971
31.886
+1.685
5.58%
jan 1, 1972
32.36
+0.474
1.49%
jan 1, 1973
33.52
+1.159
3.58%
jan 1, 1974
34.121
+0.601
1.79%
jan 1, 1975
34.494
+0.373
1.09%
jan 1, 1976
35.0
+0.506
1.47%
jan 1, 1977
36.151
+1.151
3.29%
jan 1, 1978
36.836
+0.685
1.89%
jan 1, 1979
36.879
+0.043
0.12%
jan 1, 1980
37.471
+0.592
1.61%
jan 1, 1981
38.788
+1.317
3.51%
jan 1, 1982
39.173
+0.385
0.99%
jan 1, 1983
38.828
-0.345
-0.88%
jan 1, 1984
39.233
+0.405
1.04%
jan 1, 1985
37.908
-1.326
-3.38%
jan 1, 1986
35.068
-2.84
-7.49%
jan 1, 1987
34.576
-0.492
-1.4%
jan 1, 1988
34.433
-0.143
-0.41%
jan 1, 1989
35.156
+0.723
2.1%
jan 1, 1990
34.898
-0.257
-0.73%
jan 1, 1991
34.472
-0.426
-1.22%
jan 1, 1992
34.014
-0.458
-1.33%
jan 1, 1993
32.837
-1.177
-3.46%
jan 1, 1994
32.683
-0.154
-0.47%
jan 1, 1995
32.53
-0.153
-0.47%
jan 1, 1996
32.063
-0.467
-1.44%
jan 1, 1997
32.086
+0.023
0.07%
jan 1, 1998
32.133
+0.047
0.15%
jan 1, 1999
34.39
+2.257
7.02%
jan 1, 2000
33.056
-1.334
-3.88%
jan 1, 2001
34.456
+1.4
4.24%
jan 1, 2002
34.499
+0.043
0.13%
jan 1, 2003
34.584
+0.084
0.24%
jan 1, 2004
34.561
-0.023
-0.07%
jan 1, 2005
33.753
-0.808
-2.34%
jan 1, 2006
33.834
+0.082
0.24%
jan 1, 2007
33.493
-0.341
-1.01%
jan 1, 2008
33.053
-0.44
-1.31%
jan 1, 2009
32.878
-0.175
-0.53%
jan 1, 2010
31.71
-1.168
-3.55%
jan 1, 2011
32.568
+0.858
2.71%
jan 1, 2012
31.347
-1.221
-3.75%
jan 1, 2013
31.246
-0.101
-0.32%
jan 1, 2014
31.116
-0.131
-0.42%
jan 1, 2015
31.306
+0.191
0.61%
jan 1, 2016
30.771
-0.535
-1.71%
Ranking of countries by current statistics by years


Comments: