29
/
en
AIzaSyAYiBZKx7MnpbEhh9jyipgxe19OcubqV5w
April 1, 2024
97477
Cabo Verde
CPV
true
2
1
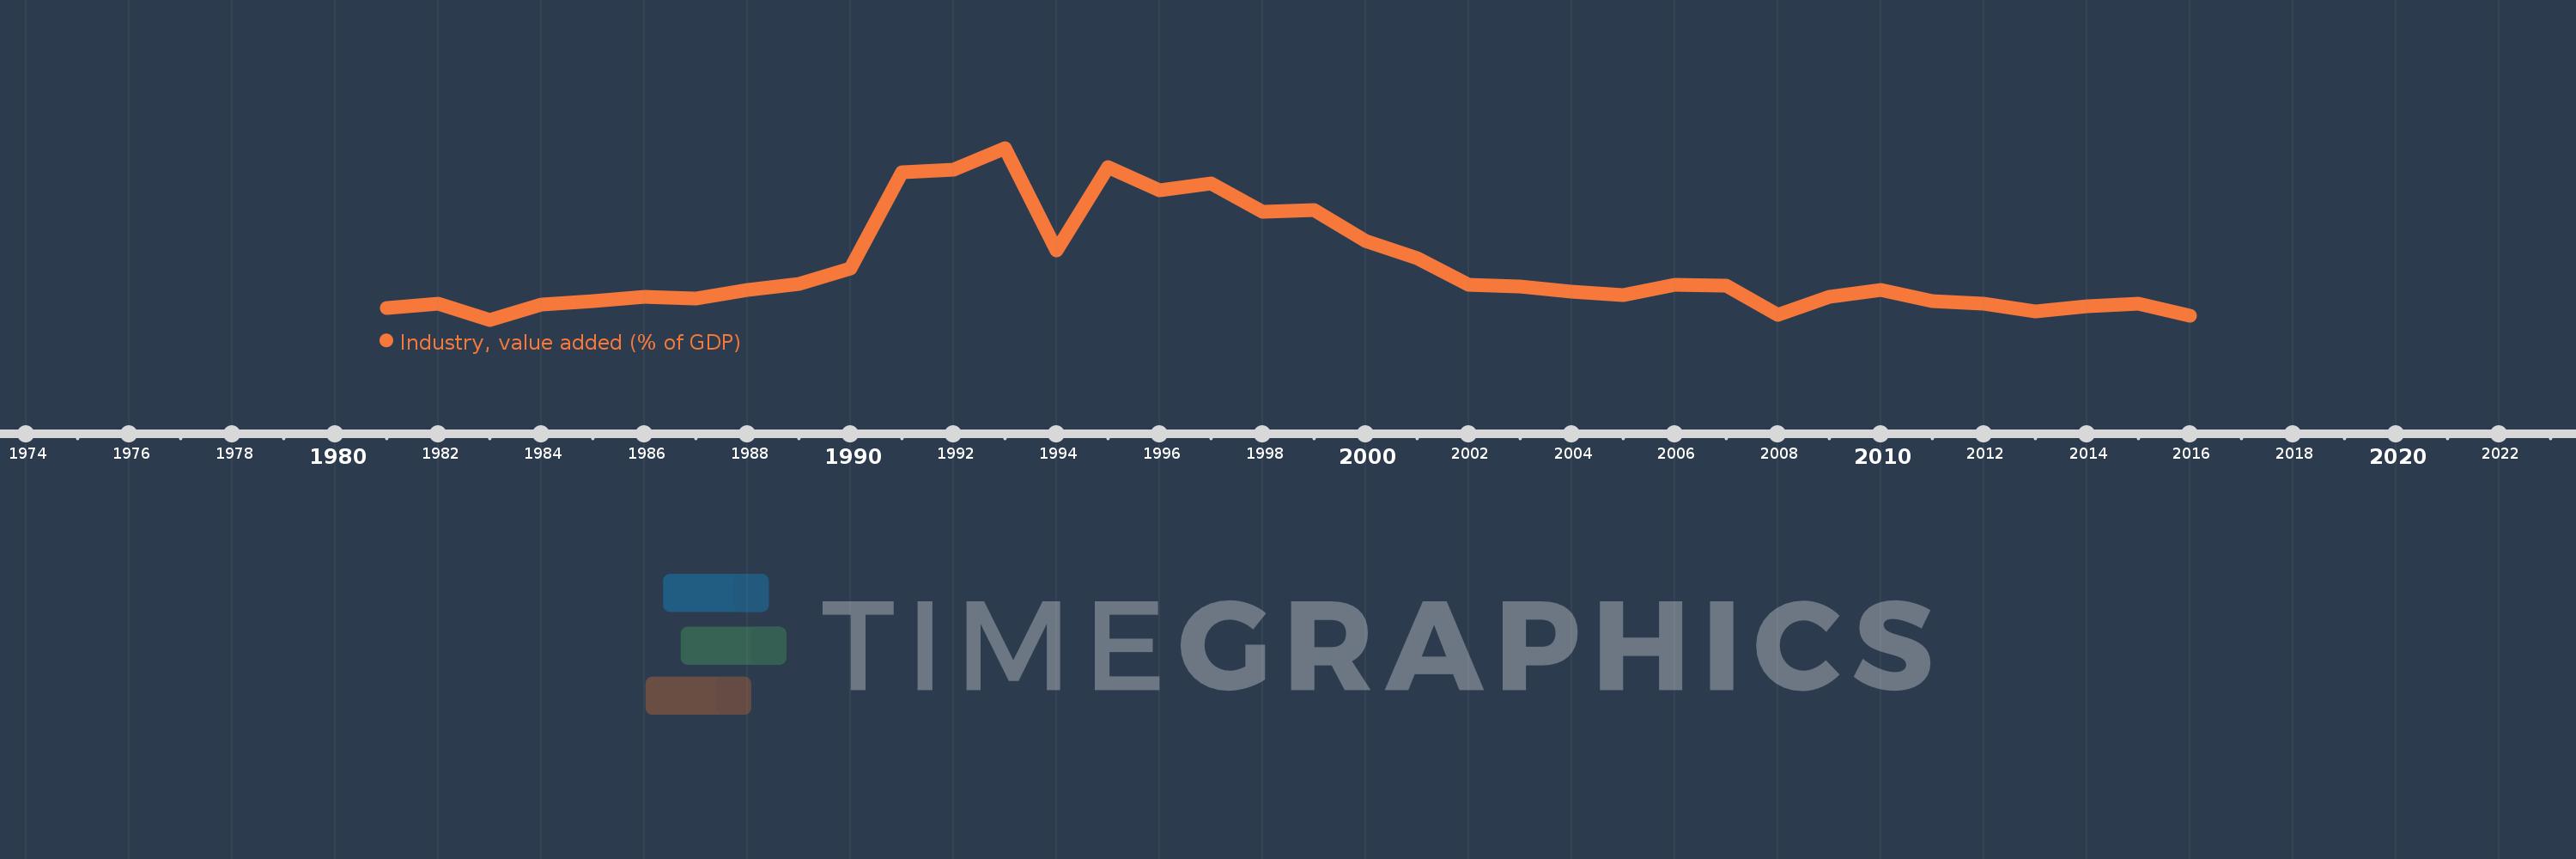
Industry, value added (% of GDP)
2016,2015,2014,2013,2012,2011,2010,2009,2008,2007,2006,2005,2004,2003,2002,2001,2000,1999,1998,1997,1996,1995,1994,1993,1992,1991,1990,1989,1988,1987,1986,1985,1984,1983,1982,1981
This statistics in other country:
AfghanistanAlbaniaAlgeriaAndorraAngolaAntigua and BarbudaArab WorldArgentinaArmeniaArubaAustraliaAustriaAzerbaijanBahamas, TheBahrainBangladeshBarbadosBelarusBelgiumBelizeBeninBermudaBhutanBoliviaBosnia and HerzegovinaBotswanaBrazilBrunei DarussalamBulgariaBurkina FasoBurundiCabo VerdeCambodiaCameroonCanadaCaribbean small statesCayman IslandsCentral African RepublicCentral Europe and the BalticsChadChileChinaColombiaComorosCongo, Dem. Rep.Congo, Rep.Costa RicaCote d'IvoireCroatiaCubaCyprusCzech RepublicDenmarkDjiboutiDominicaDominican RepublicEarly-demographic dividendEast Asia & PacificEast Asia & Pacific (excluding high income)East Asia & Pacific (IDA & IBRD countries)EcuadorEgypt, Arab Rep.El SalvadorEquatorial GuineaEritreaEstoniaEthiopiaEuro areaEurope & Central AsiaEurope & Central Asia (excluding high income)Europe & Central Asia (IDA & IBRD countries)European UnionFijiFinlandFragile and conflict affected situationsFranceGabonGambia, TheGeorgiaGermanyGhanaGreeceGrenadaGuatemalaGuineaGuinea-BissauGuyanaHeavily indebted poor countries (HIPC)High incomeHondurasHong Kong SAR, ChinaHungaryIBRD onlyIcelandIDA & IBRD totalIDA blendIDA onlyIDA totalIndiaIndonesiaIran, Islamic Rep.IrelandItalyJamaicaJapanJordanKazakhstanKenyaKiribatiKorea, Rep.KosovoKuwaitKyrgyz RepublicLao PDRLate-demographic dividendLatin America & Caribbean Latin America & Caribbean (excluding high income)Latin America & the Caribbean (IDA & IBRD countries)LatviaLeast developed countries: UN classificationLebanonLesothoLibyaLiechtensteinLithuaniaLow & middle incomeLow incomeLower middle incomeLuxembourgMacao SAR, ChinaMacedonia, FYRMadagascarMalawiMalaysiaMaldivesMaliMaltaMarshall IslandsMauritaniaMauritiusMexicoMicronesia, Fed. Sts.Middle East & North AfricaMiddle East & North Africa (excluding high income)Middle East & North Africa (IDA & IBRD countries)Middle incomeMoldovaMongoliaMontenegroMoroccoMozambiqueMyanmarNamibiaNepalNetherlandsNew CaledoniaNew ZealandNicaraguaNigerNigeriaNorth AmericaNorwayOECD membersOmanOther small statesPacific island small statesPakistanPalauPanamaPapua New GuineaParaguayPeruPhilippinesPolandPortugalPost-demographic dividendPre-demographic dividendPuerto RicoQatarRomaniaRussian FederationRwandaSao Tome and PrincipeSaudi ArabiaSenegalSerbiaSeychellesSierra LeoneSingaporeSlovak RepublicSloveniaSmall statesSolomon IslandsSomaliaSouth AfricaSouth AsiaSouth Asia (IDA & IBRD)SpainSri LankaSt. Kitts and NevisSt. LuciaSt. Vincent and the GrenadinesSub-Saharan Africa Sub-Saharan Africa (excluding high income)Sub-Saharan Africa (IDA & IBRD countries)SudanSurinameSwazilandSwedenSwitzerlandSyrian Arab RepublicTajikistanTanzaniaThailandTimor-LesteTogoTongaTrinidad and TobagoTunisiaTurkeyTurkmenistanTuvaluUgandaUkraineUnited KingdomUnited StatesUpper middle incomeUruguayUzbekistanVanuatuVenezuela, RBVietnamWest Bank and GazaWorldYemen, Rep.ZambiaZimbabwe Timeline:
This timeline shows a graph from 1981 to 2016 of Cabo Verde. No data until 1980. Number of actual observations by date: 36.
Source name:
World Development Indicators
Source organization:
World Bank national accounts data, and OECD National Accounts data files.
Categories, topics:
Economy & Growth
Last updated:
apr 23, 2017
Indicators value changes by year
Minimum:
15.809
jan 1, 1983
Maximum:
32.382
jan 1, 1993
At the date of observation
Value
Absolute change
Change from previous value
jan 1, 1981
16.96
+16.96
0.0%
jan 1, 1982
17.352
+0.392
2.31%
jan 1, 1983
15.809
-1.543
-8.89%
jan 1, 1984
17.277
+1.468
9.29%
jan 1, 1985
17.604
+0.327
1.89%
jan 1, 1986
17.984
+0.38
2.16%
jan 1, 1987
17.819
-0.164
-0.91%
jan 1, 1988
18.704
+0.885
4.96%
jan 1, 1989
19.303
+0.599
3.2%
jan 1, 1990
20.758
+1.454
7.53%
jan 1, 1991
30.066
+9.308
44.84%
jan 1, 1992
30.326
+0.261
0.87%
jan 1, 1993
32.382
+2.055
6.78%
jan 1, 1994
22.528
-9.854
-30.43%
jan 1, 1995
30.559
+8.031
35.65%
jan 1, 1996
28.294
-2.265
-7.41%
jan 1, 1997
28.931
+0.637
2.25%
jan 1, 1998
26.207
-2.723
-9.41%
jan 1, 1999
26.378
+0.171
0.65%
jan 1, 2000
23.377
-3.001
-11.38%
jan 1, 2001
21.747
-1.63
-6.97%
jan 1, 2002
19.164
-2.583
-11.88%
jan 1, 2003
19.054
-0.111
-0.58%
jan 1, 2004
18.526
-0.528
-2.77%
jan 1, 2005
18.218
-0.308
-1.66%
jan 1, 2006
19.211
+0.993
5.45%
jan 1, 2007
19.092
-0.119
-0.62%
jan 1, 2008
16.246
-2.846
-14.91%
jan 1, 2009
18.005
+1.759
10.83%
jan 1, 2010
18.692
+0.687
3.81%
jan 1, 2011
17.638
-1.054
-5.64%
jan 1, 2012
17.351
-0.287
-1.63%
jan 1, 2013
16.639
-0.712
-4.1%
jan 1, 2014
17.129
+0.489
2.94%
jan 1, 2015
17.349
+0.22
1.29%
jan 1, 2016
16.236
-1.113
-6.41%
Ranking of countries by current statistics by years


Comments: