29
/
en
AIzaSyAYiBZKx7MnpbEhh9jyipgxe19OcubqV5w
April 1, 2024
133281
Finland
FIN
true
2
1
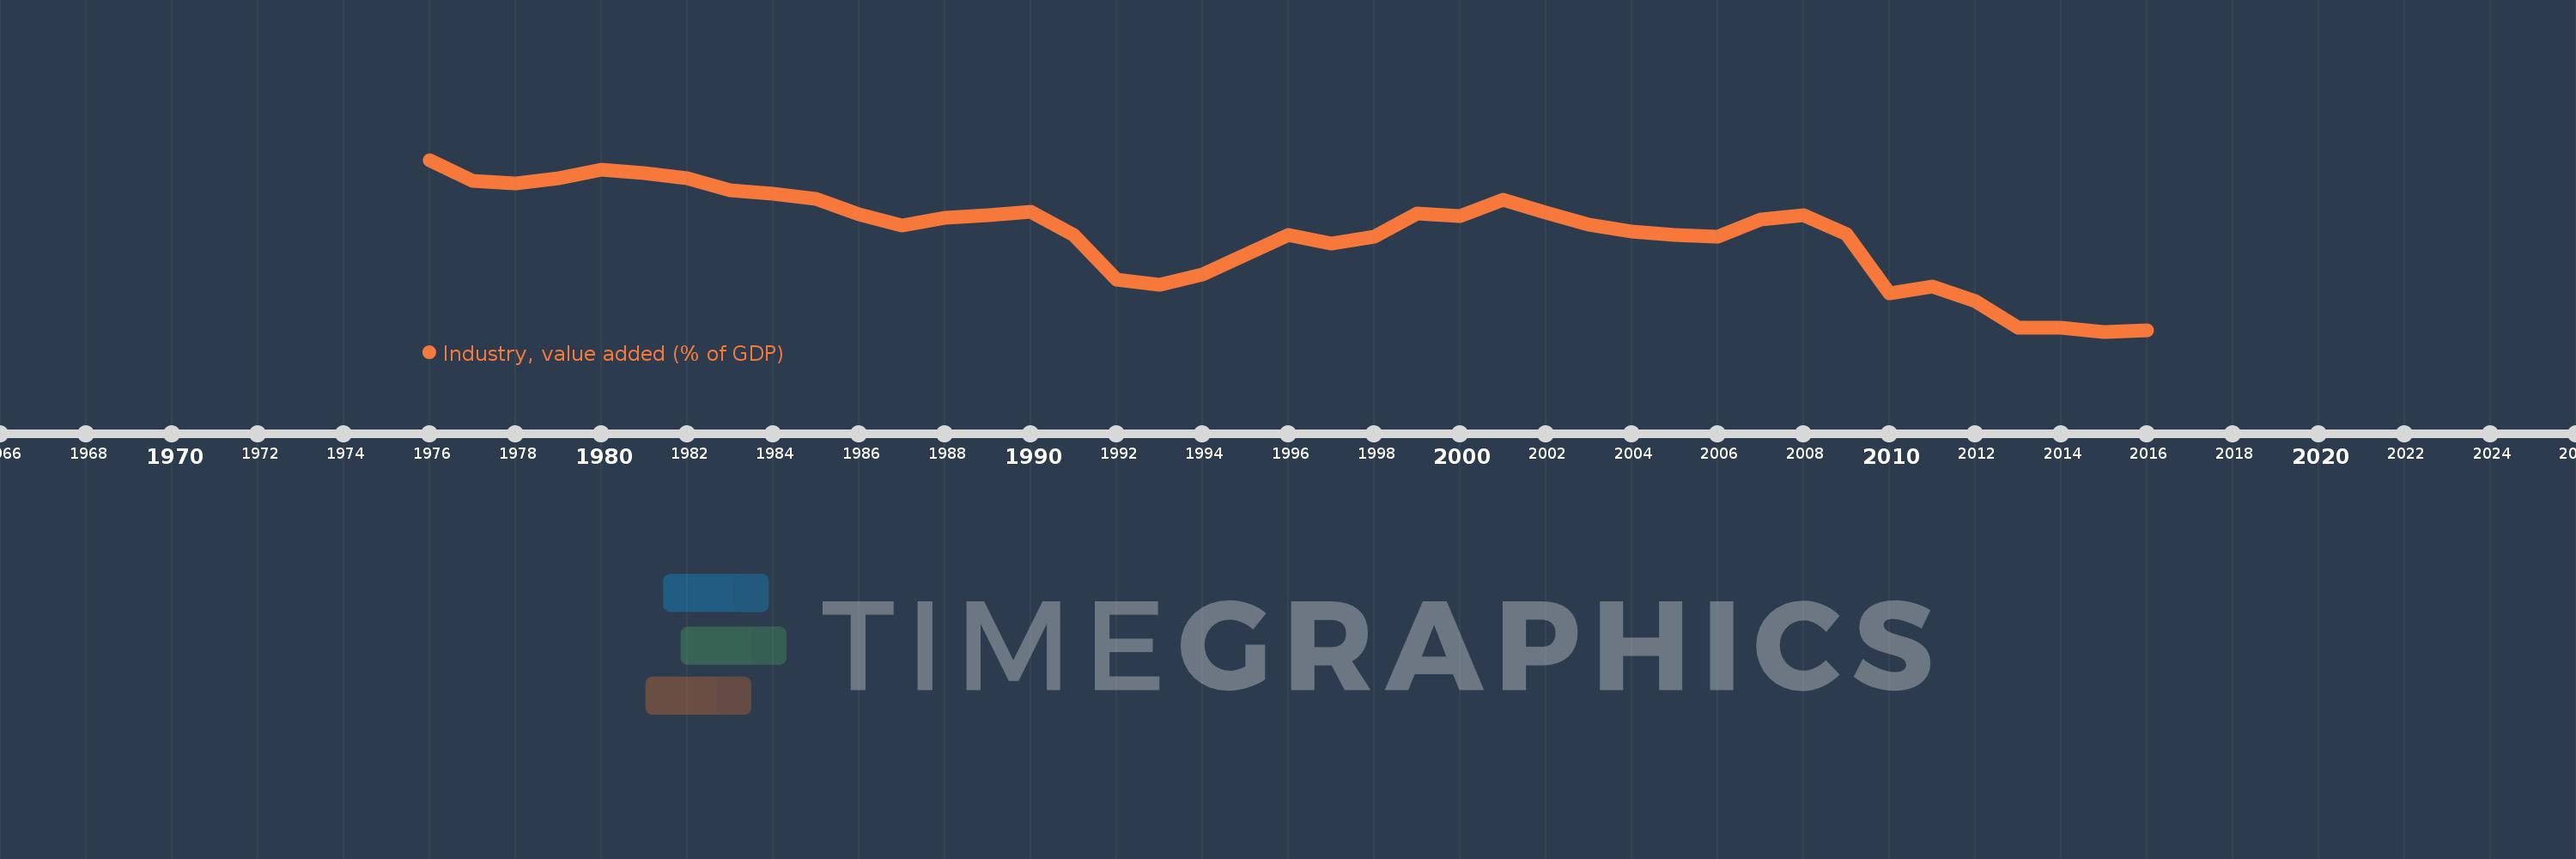
Industry, value added (% of GDP)
2016,2015,2014,2013,2012,2011,2010,2009,2008,2007,2006,2005,2004,2003,2002,2001,2000,1999,1998,1997,1996,1995,1994,1993,1992,1991,1990,1989,1988,1987,1986,1985,1984,1983,1982,1981,1980,1979,1978,1977,1976
This statistics in other country:
AfghanistanAlbaniaAlgeriaAndorraAngolaAntigua and BarbudaArab WorldArgentinaArmeniaArubaAustraliaAustriaAzerbaijanBahamas, TheBahrainBangladeshBarbadosBelarusBelgiumBelizeBeninBermudaBhutanBoliviaBosnia and HerzegovinaBotswanaBrazilBrunei DarussalamBulgariaBurkina FasoBurundiCabo VerdeCambodiaCameroonCanadaCaribbean small statesCayman IslandsCentral African RepublicCentral Europe and the BalticsChadChileChinaColombiaComorosCongo, Dem. Rep.Congo, Rep.Costa RicaCote d'IvoireCroatiaCubaCyprusCzech RepublicDenmarkDjiboutiDominicaDominican RepublicEarly-demographic dividendEast Asia & PacificEast Asia & Pacific (excluding high income)East Asia & Pacific (IDA & IBRD countries)EcuadorEgypt, Arab Rep.El SalvadorEquatorial GuineaEritreaEstoniaEthiopiaEuro areaEurope & Central AsiaEurope & Central Asia (excluding high income)Europe & Central Asia (IDA & IBRD countries)European UnionFijiFinlandFragile and conflict affected situationsFranceGabonGambia, TheGeorgiaGermanyGhanaGreeceGrenadaGuatemalaGuineaGuinea-BissauGuyanaHeavily indebted poor countries (HIPC)High incomeHondurasHong Kong SAR, ChinaHungaryIBRD onlyIcelandIDA & IBRD totalIDA blendIDA onlyIDA totalIndiaIndonesiaIran, Islamic Rep.IrelandItalyJamaicaJapanJordanKazakhstanKenyaKiribatiKorea, Rep.KosovoKuwaitKyrgyz RepublicLao PDRLate-demographic dividendLatin America & Caribbean Latin America & Caribbean (excluding high income)Latin America & the Caribbean (IDA & IBRD countries)LatviaLeast developed countries: UN classificationLebanonLesothoLibyaLiechtensteinLithuaniaLow & middle incomeLow incomeLower middle incomeLuxembourgMacao SAR, ChinaMacedonia, FYRMadagascarMalawiMalaysiaMaldivesMaliMaltaMarshall IslandsMauritaniaMauritiusMexicoMicronesia, Fed. Sts.Middle East & North AfricaMiddle East & North Africa (excluding high income)Middle East & North Africa (IDA & IBRD countries)Middle incomeMoldovaMongoliaMontenegroMoroccoMozambiqueMyanmarNamibiaNepalNetherlandsNew CaledoniaNew ZealandNicaraguaNigerNigeriaNorth AmericaNorwayOECD membersOmanOther small statesPacific island small statesPakistanPalauPanamaPapua New GuineaParaguayPeruPhilippinesPolandPortugalPost-demographic dividendPre-demographic dividendPuerto RicoQatarRomaniaRussian FederationRwandaSao Tome and PrincipeSaudi ArabiaSenegalSerbiaSeychellesSierra LeoneSingaporeSlovak RepublicSloveniaSmall statesSolomon IslandsSomaliaSouth AfricaSouth AsiaSouth Asia (IDA & IBRD)SpainSri LankaSt. Kitts and NevisSt. LuciaSt. Vincent and the GrenadinesSub-Saharan Africa Sub-Saharan Africa (excluding high income)Sub-Saharan Africa (IDA & IBRD countries)SudanSurinameSwazilandSwedenSwitzerlandSyrian Arab RepublicTajikistanTanzaniaThailandTimor-LesteTogoTongaTrinidad and TobagoTunisiaTurkeyTurkmenistanTuvaluUgandaUkraineUnited KingdomUnited StatesUpper middle incomeUruguayUzbekistanVanuatuVenezuela, RBVietnamWest Bank and GazaWorldYemen, Rep.ZambiaZimbabwe Timeline:
This timeline shows a graph from 1976 to 2016 of Finland. No data until 1975. Number of actual observations by date: 41.
Source name:
World Development Indicators
Source organization:
World Bank national accounts data, and OECD National Accounts data files.
Categories, topics:
Economy & Growth
Last updated:
apr 23, 2017
Indicators value changes by year
Minimum:
26.747
jan 1, 2015
Maximum:
38.987
jan 1, 1976
At the date of observation
Value
Absolute change
Change from previous value
jan 1, 1976
38.987
+38.987
0.0%
jan 1, 1977
37.501
-1.487
-3.81%
jan 1, 1978
37.331
-0.17
-0.45%
jan 1, 1979
37.679
+0.348
0.93%
jan 1, 1980
38.294
+0.615
1.63%
jan 1, 1981
38.055
-0.239
-0.62%
jan 1, 1982
37.664
-0.391
-1.03%
jan 1, 1983
36.79
-0.875
-2.32%
jan 1, 1984
36.555
-0.234
-0.64%
jan 1, 1985
36.226
-0.33
-0.9%
jan 1, 1986
35.074
-1.152
-3.18%
jan 1, 1987
34.278
-0.796
-2.27%
jan 1, 1988
34.83
+0.553
1.61%
jan 1, 1989
35.03
+0.199
0.57%
jan 1, 1990
35.285
+0.255
0.73%
jan 1, 1991
33.607
-1.677
-4.75%
jan 1, 1992
30.45
-3.158
-9.4%
jan 1, 1993
30.083
-0.367
-1.2%
jan 1, 1994
30.816
+0.733
2.44%
jan 1, 1995
32.235
+1.418
4.6%
jan 1, 1996
33.653
+1.418
4.4%
jan 1, 1997
33.014
-0.639
-1.9%
jan 1, 1998
33.48
+0.466
1.41%
jan 1, 1999
35.134
+1.654
4.94%
jan 1, 2000
34.975
-0.159
-0.45%
jan 1, 2001
36.157
+1.182
3.38%
jan 1, 2002
35.208
-0.949
-2.62%
jan 1, 2003
34.383
-0.825
-2.34%
jan 1, 2004
33.882
-0.501
-1.46%
jan 1, 2005
33.606
-0.276
-0.81%
jan 1, 2006
33.54
-0.066
-0.2%
jan 1, 2007
34.745
+1.205
3.59%
jan 1, 2008
35.053
+0.309
0.89%
jan 1, 2009
33.696
-1.357
-3.87%
jan 1, 2010
29.44
-4.256
-12.63%
jan 1, 2011
29.974
+0.534
1.81%
jan 1, 2012
28.89
-1.083
-3.61%
jan 1, 2013
27.04
-1.85
-6.4%
jan 1, 2014
27.019
-0.022
-0.08%
jan 1, 2015
26.747
-0.271
-1.0%
jan 1, 2016
26.848
+0.101
0.38%
Ranking of countries by current statistics by years


Comments: