29
/
en
AIzaSyAYiBZKx7MnpbEhh9jyipgxe19OcubqV5w
April 1, 2024
51010
Middle income
MIC
false
2
1
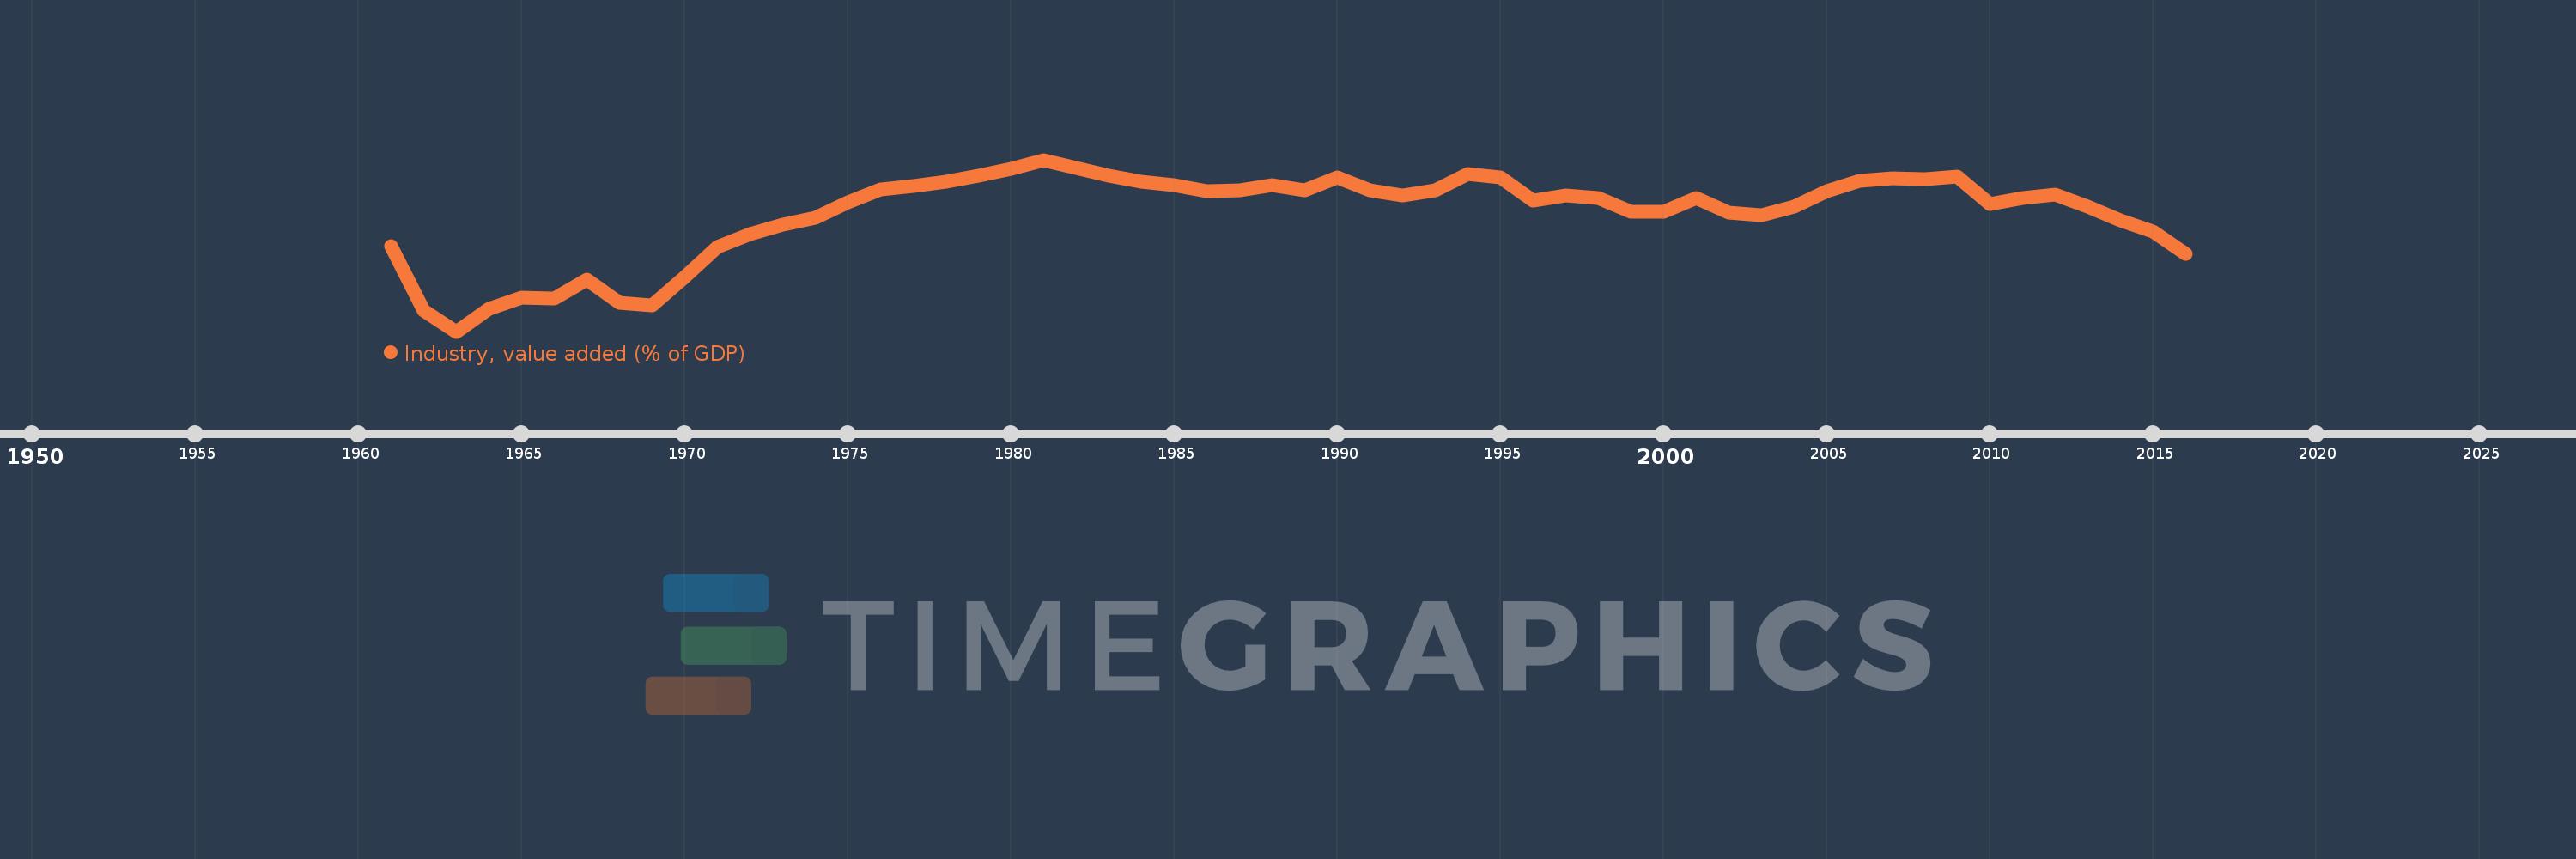
Industry, value added (% of GDP)
2016,2015,2014,2013,2012,2011,2010,2009,2008,2007,2006,2005,2004,2003,2002,2001,2000,1999,1998,1997,1996,1995,1994,1993,1992,1991,1990,1989,1988,1987,1986,1985,1984,1983,1982,1981,1980,1979,1978,1977,1976,1975,1974,1973,1972,1971,1970,1969,1968,1967,1966,1965,1964,1963,1962,1961
This statistics in other country:
AfghanistanAlbaniaAlgeriaAndorraAngolaAntigua and BarbudaArab WorldArgentinaArmeniaArubaAustraliaAustriaAzerbaijanBahamas, TheBahrainBangladeshBarbadosBelarusBelgiumBelizeBeninBermudaBhutanBoliviaBosnia and HerzegovinaBotswanaBrazilBrunei DarussalamBulgariaBurkina FasoBurundiCabo VerdeCambodiaCameroonCanadaCaribbean small statesCayman IslandsCentral African RepublicCentral Europe and the BalticsChadChileChinaColombiaComorosCongo, Dem. Rep.Congo, Rep.Costa RicaCote d'IvoireCroatiaCubaCyprusCzech RepublicDenmarkDjiboutiDominicaDominican RepublicEarly-demographic dividendEast Asia & PacificEast Asia & Pacific (excluding high income)East Asia & Pacific (IDA & IBRD countries)EcuadorEgypt, Arab Rep.El SalvadorEquatorial GuineaEritreaEstoniaEthiopiaEuro areaEurope & Central AsiaEurope & Central Asia (excluding high income)Europe & Central Asia (IDA & IBRD countries)European UnionFijiFinlandFragile and conflict affected situationsFranceGabonGambia, TheGeorgiaGermanyGhanaGreeceGrenadaGuatemalaGuineaGuinea-BissauGuyanaHeavily indebted poor countries (HIPC)High incomeHondurasHong Kong SAR, ChinaHungaryIBRD onlyIcelandIDA & IBRD totalIDA blendIDA onlyIDA totalIndiaIndonesiaIran, Islamic Rep.IrelandItalyJamaicaJapanJordanKazakhstanKenyaKiribatiKorea, Rep.KosovoKuwaitKyrgyz RepublicLao PDRLate-demographic dividendLatin America & Caribbean Latin America & Caribbean (excluding high income)Latin America & the Caribbean (IDA & IBRD countries)LatviaLeast developed countries: UN classificationLebanonLesothoLibyaLiechtensteinLithuaniaLow & middle incomeLow incomeLower middle incomeLuxembourgMacao SAR, ChinaMacedonia, FYRMadagascarMalawiMalaysiaMaldivesMaliMaltaMarshall IslandsMauritaniaMauritiusMexicoMicronesia, Fed. Sts.Middle East & North AfricaMiddle East & North Africa (excluding high income)Middle East & North Africa (IDA & IBRD countries)Middle incomeMoldovaMongoliaMontenegroMoroccoMozambiqueMyanmarNamibiaNepalNetherlandsNew CaledoniaNew ZealandNicaraguaNigerNigeriaNorth AmericaNorwayOECD membersOmanOther small statesPacific island small statesPakistanPalauPanamaPapua New GuineaParaguayPeruPhilippinesPolandPortugalPost-demographic dividendPre-demographic dividendPuerto RicoQatarRomaniaRussian FederationRwandaSao Tome and PrincipeSaudi ArabiaSenegalSerbiaSeychellesSierra LeoneSingaporeSlovak RepublicSloveniaSmall statesSolomon IslandsSomaliaSouth AfricaSouth AsiaSouth Asia (IDA & IBRD)SpainSri LankaSt. Kitts and NevisSt. LuciaSt. Vincent and the GrenadinesSub-Saharan Africa Sub-Saharan Africa (excluding high income)Sub-Saharan Africa (IDA & IBRD countries)SudanSurinameSwazilandSwedenSwitzerlandSyrian Arab RepublicTajikistanTanzaniaThailandTimor-LesteTogoTongaTrinidad and TobagoTunisiaTurkeyTurkmenistanTuvaluUgandaUkraineUnited KingdomUnited StatesUpper middle incomeUruguayUzbekistanVanuatuVenezuela, RBVietnamWest Bank and GazaWorldYemen, Rep.ZambiaZimbabwe Timeline:
This timeline shows a graph from 1961 to 2016 of Middle income. No data until 1960. Number of actual observations by date: 56.
Source name:
World Development Indicators
Source organization:
World Bank national accounts data, and OECD National Accounts data files.
Categories, topics:
Economy & Growth
Last updated:
apr 23, 2017
Indicators value changes by year
Minimum:
27.852
jan 1, 1963
Maximum:
40.164
jan 1, 1981
At the date of observation
Value
Absolute change
Change from previous value
jan 1, 1961
33.991
+33.991
0.0%
jan 1, 1962
29.368
-4.622
-13.6%
jan 1, 1963
27.852
-1.516
-5.16%
jan 1, 1964
29.462
+1.61
5.78%
jan 1, 1965
30.289
+0.827
2.81%
jan 1, 1966
30.218
-0.071
-0.24%
jan 1, 1967
31.585
+1.367
4.52%
jan 1, 1968
29.917
-1.668
-5.28%
jan 1, 1969
29.741
-0.176
-0.59%
jan 1, 1970
31.79
+2.049
6.89%
jan 1, 1971
33.946
+2.156
6.78%
jan 1, 1972
34.836
+0.89
2.62%
jan 1, 1973
35.527
+0.69
1.98%
jan 1, 1974
36.029
+0.502
1.41%
jan 1, 1975
37.114
+1.085
3.01%
jan 1, 1976
38.052
+0.938
2.53%
jan 1, 1977
38.268
+0.216
0.57%
jan 1, 1978
38.587
+0.319
0.83%
jan 1, 1979
39.016
+0.429
1.11%
jan 1, 1980
39.525
+0.51
1.31%
jan 1, 1981
40.164
+0.639
1.62%
jan 1, 1982
39.603
-0.561
-1.4%
jan 1, 1983
39.05
-0.553
-1.4%
jan 1, 1984
38.62
-0.43
-1.1%
jan 1, 1985
38.345
-0.275
-0.71%
jan 1, 1986
37.888
-0.457
-1.19%
jan 1, 1987
37.951
+0.063
0.17%
jan 1, 1988
38.37
+0.419
1.1%
jan 1, 1989
38.009
-0.361
-0.94%
jan 1, 1990
38.892
+0.883
2.32%
jan 1, 1991
37.978
-0.914
-2.35%
jan 1, 1992
37.636
-0.342
-0.9%
jan 1, 1993
38.008
+0.372
0.99%
jan 1, 1994
39.159
+1.151
3.03%
jan 1, 1995
38.897
-0.262
-0.67%
jan 1, 1996
37.267
-1.63
-4.19%
jan 1, 1997
37.606
+0.339
0.91%
jan 1, 1998
37.421
-0.185
-0.49%
jan 1, 1999
36.418
-1.002
-2.68%
jan 1, 2000
36.463
+0.045
0.12%
jan 1, 2001
37.398
+0.935
2.56%
jan 1, 2002
36.367
-1.032
-2.76%
jan 1, 2003
36.197
-0.17
-0.47%
jan 1, 2004
36.837
+0.641
1.77%
jan 1, 2005
37.907
+1.07
2.9%
jan 1, 2006
38.659
+0.752
1.98%
jan 1, 2007
38.867
+0.209
0.54%
jan 1, 2008
38.794
-0.073
-0.19%
jan 1, 2009
38.948
+0.154
0.4%
jan 1, 2010
37.01
-1.938
-4.98%
jan 1, 2011
37.437
+0.427
1.15%
jan 1, 2012
37.69
+0.253
0.68%
jan 1, 2013
36.795
-0.895
-2.37%
jan 1, 2014
35.824
-0.972
-2.64%
jan 1, 2015
35.027
-0.796
-2.22%
jan 1, 2016
33.431
-1.596
-4.56%
Ranking of countries by current statistics by years


Comments: