29
/
en
AIzaSyAYiBZKx7MnpbEhh9jyipgxe19OcubqV5w
April 1, 2024
222334
Peru
PER
true
2
1
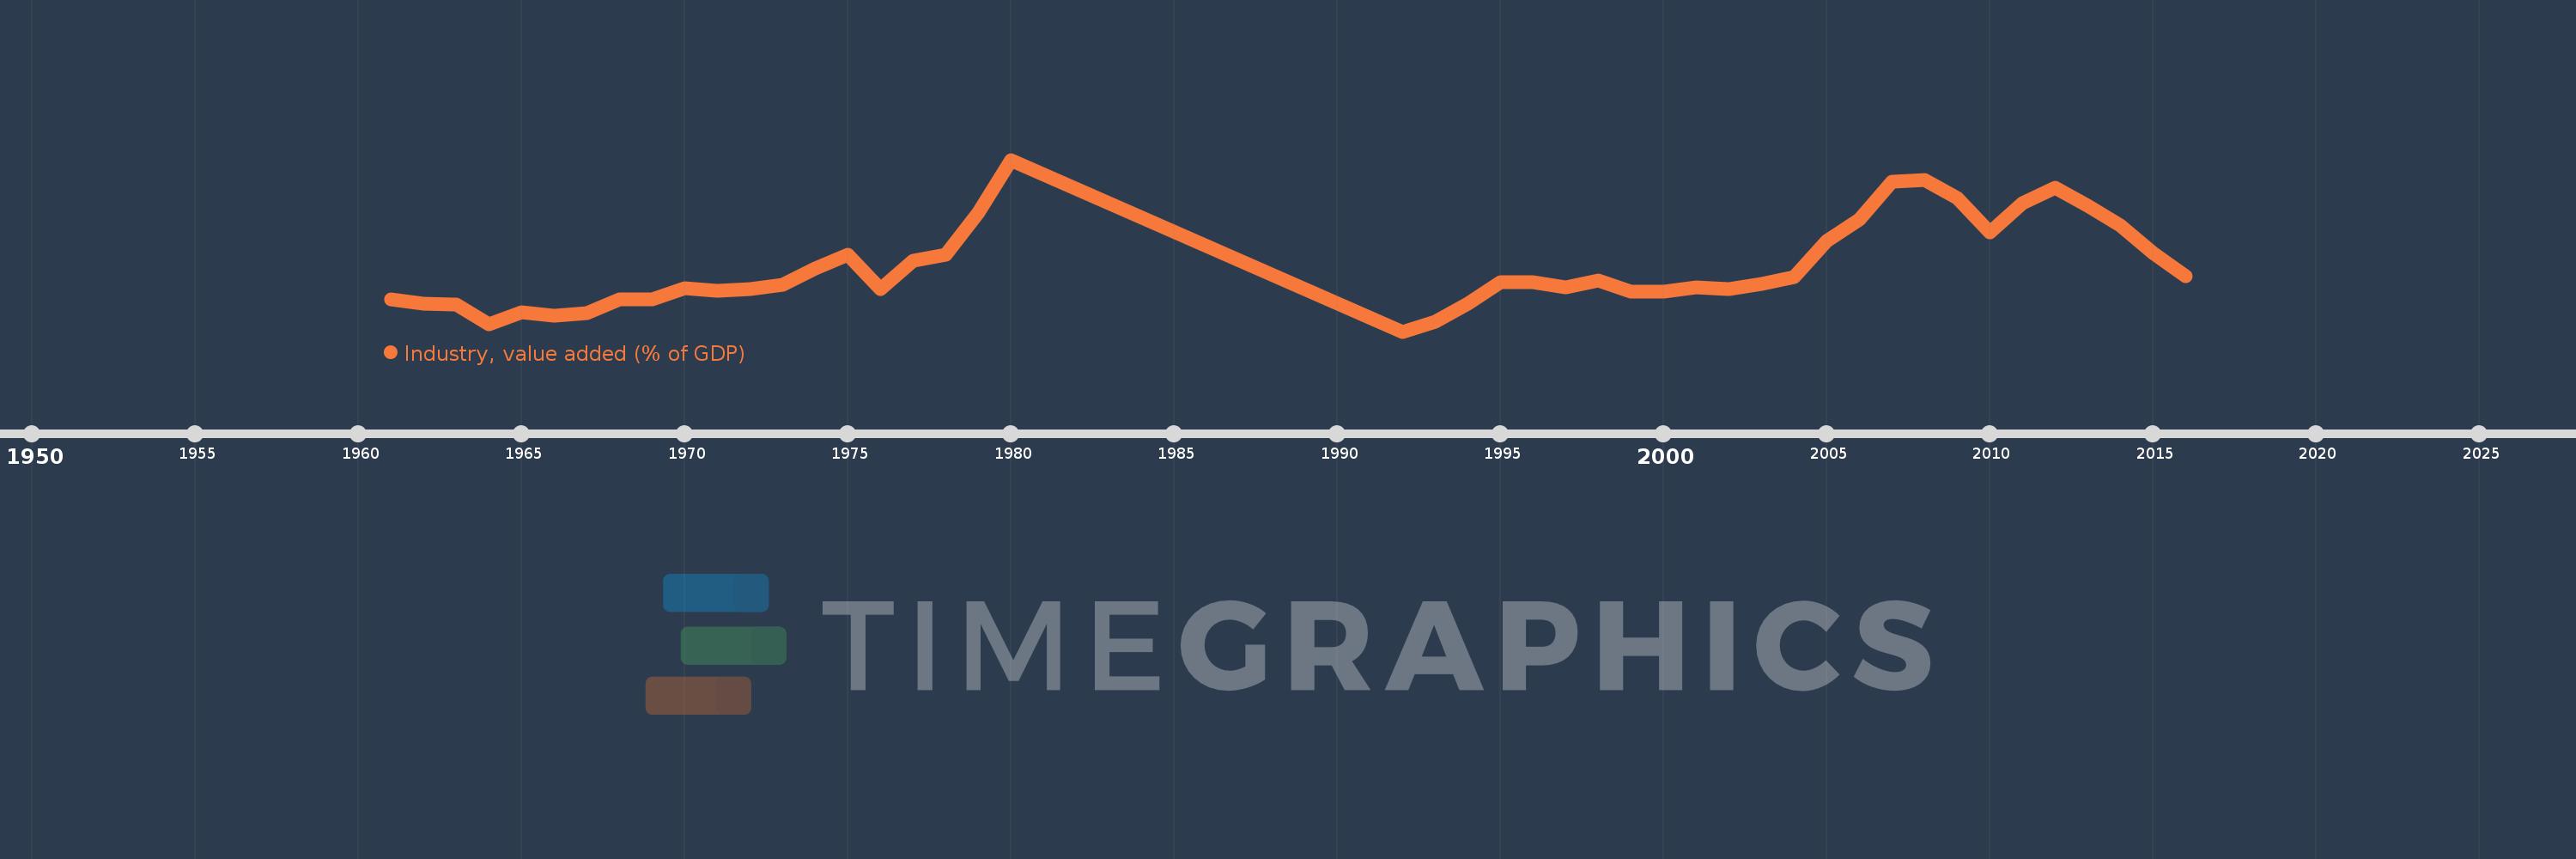
Industry, value added (% of GDP)
2016,2015,2014,2013,2012,2011,2010,2009,2008,2007,2006,2005,2004,2003,2002,2001,2000,1999,1998,1997,1996,1995,1994,1993,1992,1980,1979,1978,1977,1976,1975,1974,1973,1972,1971,1970,1969,1968,1967,1966,1965,1964,1963,1962,1961
This statistics in other country:
AfghanistanAlbaniaAlgeriaAndorraAngolaAntigua and BarbudaArab WorldArgentinaArmeniaArubaAustraliaAustriaAzerbaijanBahamas, TheBahrainBangladeshBarbadosBelarusBelgiumBelizeBeninBermudaBhutanBoliviaBosnia and HerzegovinaBotswanaBrazilBrunei DarussalamBulgariaBurkina FasoBurundiCabo VerdeCambodiaCameroonCanadaCaribbean small statesCayman IslandsCentral African RepublicCentral Europe and the BalticsChadChileChinaColombiaComorosCongo, Dem. Rep.Congo, Rep.Costa RicaCote d'IvoireCroatiaCubaCyprusCzech RepublicDenmarkDjiboutiDominicaDominican RepublicEarly-demographic dividendEast Asia & PacificEast Asia & Pacific (excluding high income)East Asia & Pacific (IDA & IBRD countries)EcuadorEgypt, Arab Rep.El SalvadorEquatorial GuineaEritreaEstoniaEthiopiaEuro areaEurope & Central AsiaEurope & Central Asia (excluding high income)Europe & Central Asia (IDA & IBRD countries)European UnionFijiFinlandFragile and conflict affected situationsFranceGabonGambia, TheGeorgiaGermanyGhanaGreeceGrenadaGuatemalaGuineaGuinea-BissauGuyanaHeavily indebted poor countries (HIPC)High incomeHondurasHong Kong SAR, ChinaHungaryIBRD onlyIcelandIDA & IBRD totalIDA blendIDA onlyIDA totalIndiaIndonesiaIran, Islamic Rep.IrelandItalyJamaicaJapanJordanKazakhstanKenyaKiribatiKorea, Rep.KosovoKuwaitKyrgyz RepublicLao PDRLate-demographic dividendLatin America & Caribbean Latin America & Caribbean (excluding high income)Latin America & the Caribbean (IDA & IBRD countries)LatviaLeast developed countries: UN classificationLebanonLesothoLibyaLiechtensteinLithuaniaLow & middle incomeLow incomeLower middle incomeLuxembourgMacao SAR, ChinaMacedonia, FYRMadagascarMalawiMalaysiaMaldivesMaliMaltaMarshall IslandsMauritaniaMauritiusMexicoMicronesia, Fed. Sts.Middle East & North AfricaMiddle East & North Africa (excluding high income)Middle East & North Africa (IDA & IBRD countries)Middle incomeMoldovaMongoliaMontenegroMoroccoMozambiqueMyanmarNamibiaNepalNetherlandsNew CaledoniaNew ZealandNicaraguaNigerNigeriaNorth AmericaNorwayOECD membersOmanOther small statesPacific island small statesPakistanPalauPanamaPapua New GuineaParaguayPeruPhilippinesPolandPortugalPost-demographic dividendPre-demographic dividendPuerto RicoQatarRomaniaRussian FederationRwandaSao Tome and PrincipeSaudi ArabiaSenegalSerbiaSeychellesSierra LeoneSingaporeSlovak RepublicSloveniaSmall statesSolomon IslandsSomaliaSouth AfricaSouth AsiaSouth Asia (IDA & IBRD)SpainSri LankaSt. Kitts and NevisSt. LuciaSt. Vincent and the GrenadinesSub-Saharan Africa Sub-Saharan Africa (excluding high income)Sub-Saharan Africa (IDA & IBRD countries)SudanSurinameSwazilandSwedenSwitzerlandSyrian Arab RepublicTajikistanTanzaniaThailandTimor-LesteTogoTongaTrinidad and TobagoTunisiaTurkeyTurkmenistanTuvaluUgandaUkraineUnited KingdomUnited StatesUpper middle incomeUruguayUzbekistanVanuatuVenezuela, RBVietnamWest Bank and GazaWorldYemen, Rep.ZambiaZimbabwe Timeline:
This timeline shows a graph from 1961 to 2016 of Peru. No data until 1960. Number of actual observations by date: 45.
Source name:
World Development Indicators
Source organization:
World Bank national accounts data, and OECD National Accounts data files.
Categories, topics:
Economy & Growth
Last updated:
apr 23, 2017
Indicators value changes by year
Minimum:
28.084
jan 1, 1992
Maximum:
42.824
jan 1, 1980
At the date of observation
Value
Absolute change
Change from previous value
jan 1, 1961
30.811
+30.811
0.0%
jan 1, 1962
30.447
-0.364
-1.18%
jan 1, 1963
30.411
-0.036
-0.12%
jan 1, 1964
28.705
-1.707
-5.61%
jan 1, 1965
29.749
+1.045
3.64%
jan 1, 1966
29.451
-0.298
-1.0%
jan 1, 1967
29.655
+0.204
0.69%
jan 1, 1968
30.811
+1.156
3.9%
jan 1, 1969
30.819
+0.008
0.02%
jan 1, 1970
31.831
+1.012
3.28%
jan 1, 1971
31.571
-0.26
-0.82%
jan 1, 1972
31.764
+0.193
0.61%
jan 1, 1973
32.12
+0.356
1.12%
jan 1, 1974
33.486
+1.366
4.25%
jan 1, 1975
34.668
+1.181
3.53%
jan 1, 1976
31.74
-2.927
-8.44%
jan 1, 1977
34.194
+2.453
7.73%
jan 1, 1978
34.644
+0.45
1.32%
jan 1, 1979
38.284
+3.64
10.51%
jan 1, 1980
42.824
+4.54
11.86%
jan 1, 1992
28.084
-14.74
-34.42%
jan 1, 1993
28.896
+0.812
2.89%
jan 1, 1994
30.51
+1.614
5.59%
jan 1, 1995
32.298
+1.788
5.86%
jan 1, 1996
32.312
+0.015
0.05%
jan 1, 1997
31.916
-0.396
-1.23%
jan 1, 1998
32.46
+0.544
1.7%
jan 1, 1999
31.508
-0.952
-2.93%
jan 1, 2000
31.475
-0.032
-0.1%
jan 1, 2001
31.86
+0.384
1.22%
jan 1, 2002
31.752
-0.108
-0.34%
jan 1, 2003
32.194
+0.442
1.39%
jan 1, 2004
32.787
+0.593
1.84%
jan 1, 2005
35.89
+3.103
9.46%
jan 1, 2006
37.735
+1.845
5.14%
jan 1, 2007
40.947
+3.212
8.51%
jan 1, 2008
41.107
+0.16
0.39%
jan 1, 2009
39.55
-1.557
-3.79%
jan 1, 2010
36.592
-2.958
-7.48%
jan 1, 2011
39.076
+2.485
6.79%
jan 1, 2012
40.433
+1.356
3.47%
jan 1, 2013
38.882
-1.55
-3.83%
jan 1, 2014
37.182
-1.7
-4.37%
jan 1, 2015
34.819
-2.363
-6.35%
jan 1, 2016
32.835
-1.985
-5.7%
Ranking of countries by current statistics by years


Comments: