29
/
en
AIzaSyAYiBZKx7MnpbEhh9jyipgxe19OcubqV5w
April 1, 2024
49106
Middle East & North Africa (excluding high income)
MNA
false
2
1
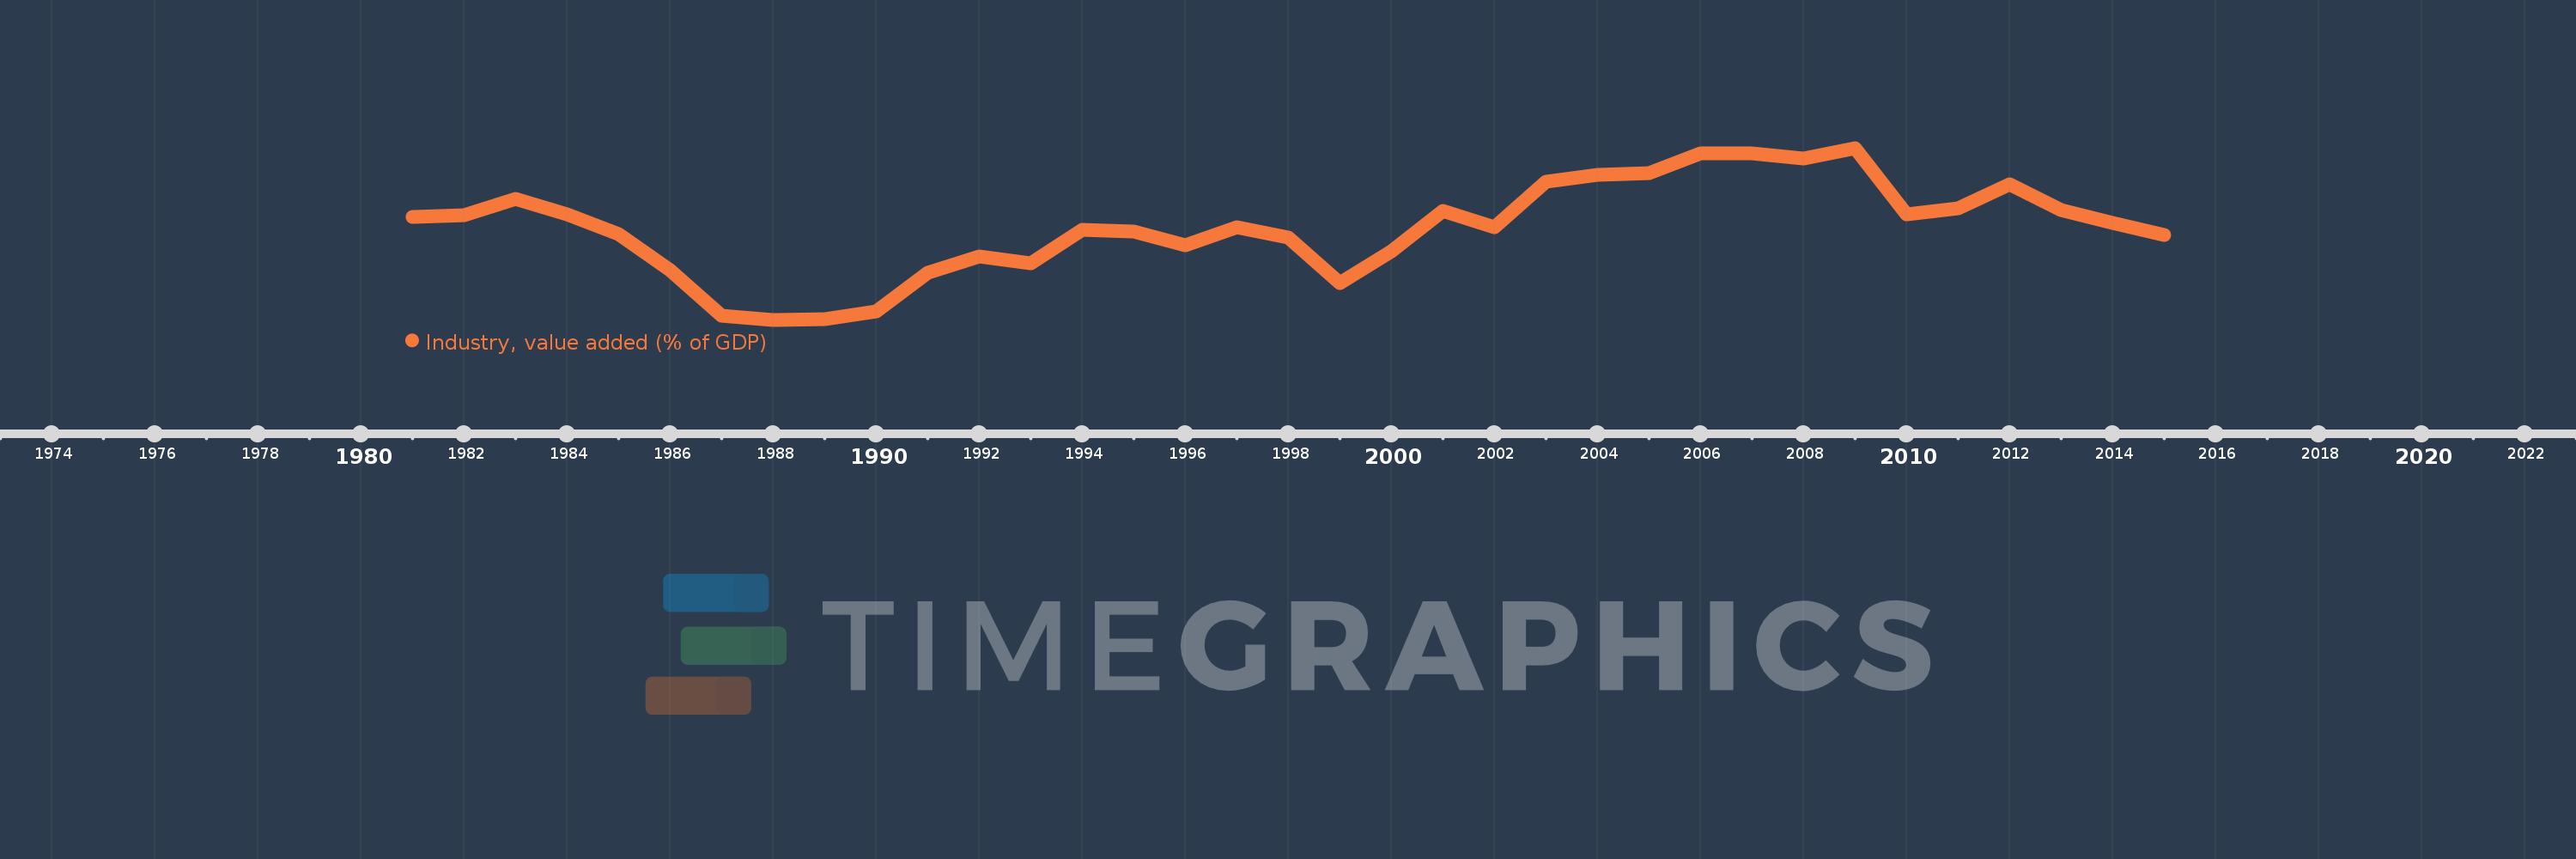
Industry, value added (% of GDP)
2015,2014,2013,2012,2011,2010,2009,2008,2007,2006,2005,2004,2003,2002,2001,2000,1999,1998,1997,1996,1995,1994,1993,1992,1991,1990,1989,1988,1987,1986,1985,1984,1983,1982,1981
This statistics in other country:
AfghanistanAlbaniaAlgeriaAndorraAngolaAntigua and BarbudaArab WorldArgentinaArmeniaArubaAustraliaAustriaAzerbaijanBahamas, TheBahrainBangladeshBarbadosBelarusBelgiumBelizeBeninBermudaBhutanBoliviaBosnia and HerzegovinaBotswanaBrazilBrunei DarussalamBulgariaBurkina FasoBurundiCabo VerdeCambodiaCameroonCanadaCaribbean small statesCayman IslandsCentral African RepublicCentral Europe and the BalticsChadChileChinaColombiaComorosCongo, Dem. Rep.Congo, Rep.Costa RicaCote d'IvoireCroatiaCubaCyprusCzech RepublicDenmarkDjiboutiDominicaDominican RepublicEarly-demographic dividendEast Asia & PacificEast Asia & Pacific (excluding high income)East Asia & Pacific (IDA & IBRD countries)EcuadorEgypt, Arab Rep.El SalvadorEquatorial GuineaEritreaEstoniaEthiopiaEuro areaEurope & Central AsiaEurope & Central Asia (excluding high income)Europe & Central Asia (IDA & IBRD countries)European UnionFijiFinlandFragile and conflict affected situationsFranceGabonGambia, TheGeorgiaGermanyGhanaGreeceGrenadaGuatemalaGuineaGuinea-BissauGuyanaHeavily indebted poor countries (HIPC)High incomeHondurasHong Kong SAR, ChinaHungaryIBRD onlyIcelandIDA & IBRD totalIDA blendIDA onlyIDA totalIndiaIndonesiaIran, Islamic Rep.IrelandItalyJamaicaJapanJordanKazakhstanKenyaKiribatiKorea, Rep.KosovoKuwaitKyrgyz RepublicLao PDRLate-demographic dividendLatin America & Caribbean Latin America & Caribbean (excluding high income)Latin America & the Caribbean (IDA & IBRD countries)LatviaLeast developed countries: UN classificationLebanonLesothoLibyaLiechtensteinLithuaniaLow & middle incomeLow incomeLower middle incomeLuxembourgMacao SAR, ChinaMacedonia, FYRMadagascarMalawiMalaysiaMaldivesMaliMaltaMarshall IslandsMauritaniaMauritiusMexicoMicronesia, Fed. Sts.Middle East & North AfricaMiddle East & North Africa (excluding high income)Middle East & North Africa (IDA & IBRD countries)Middle incomeMoldovaMongoliaMontenegroMoroccoMozambiqueMyanmarNamibiaNepalNetherlandsNew CaledoniaNew ZealandNicaraguaNigerNigeriaNorth AmericaNorwayOECD membersOmanOther small statesPacific island small statesPakistanPalauPanamaPapua New GuineaParaguayPeruPhilippinesPolandPortugalPost-demographic dividendPre-demographic dividendPuerto RicoQatarRomaniaRussian FederationRwandaSao Tome and PrincipeSaudi ArabiaSenegalSerbiaSeychellesSierra LeoneSingaporeSlovak RepublicSloveniaSmall statesSolomon IslandsSomaliaSouth AfricaSouth AsiaSouth Asia (IDA & IBRD)SpainSri LankaSt. Kitts and NevisSt. LuciaSt. Vincent and the GrenadinesSub-Saharan Africa Sub-Saharan Africa (excluding high income)Sub-Saharan Africa (IDA & IBRD countries)SudanSurinameSwazilandSwedenSwitzerlandSyrian Arab RepublicTajikistanTanzaniaThailandTimor-LesteTogoTongaTrinidad and TobagoTunisiaTurkeyTurkmenistanTuvaluUgandaUkraineUnited KingdomUnited StatesUpper middle incomeUruguayUzbekistanVanuatuVenezuela, RBVietnamWest Bank and GazaWorldYemen, Rep.ZambiaZimbabwe Timeline:
This timeline shows a graph from 1981 to 2015 of Middle East & North Africa (excluding high income). No data until 1980. Number of actual observations by date: 35.
Source name:
World Development Indicators
Source organization:
World Bank national accounts data, and OECD National Accounts data files.
Categories, topics:
Economy & Growth
Last updated:
apr 23, 2017
Indicators value changes by year
Maximum:
45.106
jan 1, 2009
At the date of observation
Value
Absolute change
Change from previous value
jan 1, 1981
39.007
+39.007
0.0%
jan 1, 1982
39.178
+0.171
0.44%
jan 1, 1983
40.568
+1.389
3.55%
jan 1, 1984
39.246
-1.321
-3.26%
jan 1, 1985
37.483
-1.764
-4.49%
jan 1, 1986
34.292
-3.191
-8.51%
jan 1, 1987
30.265
-4.026
-11.74%
jan 1, 1988
29.88
-0.386
-1.27%
jan 1, 1989
29.936
+0.056
0.19%
jan 1, 1990
30.627
+0.691
2.31%
jan 1, 1991
34.052
+3.425
11.18%
jan 1, 1992
35.522
+1.471
4.32%
jan 1, 1993
34.914
-0.608
-1.71%
jan 1, 1994
37.884
+2.97
8.51%
jan 1, 1995
37.726
-0.158
-0.42%
jan 1, 1996
36.495
-1.231
-3.26%
jan 1, 1997
38.116
+1.621
4.44%
jan 1, 1998
37.168
-0.948
-2.49%
jan 1, 1999
33.101
-4.066
-10.94%
jan 1, 2000
35.969
+2.868
8.66%
jan 1, 2001
39.494
+3.525
9.8%
jan 1, 2002
38.046
-1.448
-3.67%
jan 1, 2003
42.089
+4.044
10.63%
jan 1, 2004
42.761
+0.671
1.6%
jan 1, 2005
42.906
+0.146
0.34%
jan 1, 2006
44.654
+1.747
4.07%
jan 1, 2007
44.601
-0.053
-0.12%
jan 1, 2008
44.154
-0.447
-1.0%
jan 1, 2009
45.106
+0.952
2.16%
jan 1, 2010
39.21
-5.896
-13.07%
jan 1, 2011
39.749
+0.539
1.37%
jan 1, 2012
41.894
+2.145
5.4%
jan 1, 2013
39.615
-2.279
-5.44%
jan 1, 2014
38.483
-1.132
-2.86%
jan 1, 2015
37.415
-1.069
-2.78%
Ranking of countries by current statistics by years


Comments: