29
/
en
AIzaSyAYiBZKx7MnpbEhh9jyipgxe19OcubqV5w
April 1, 2024
112396
Costa Rica
CRI
true
2
1
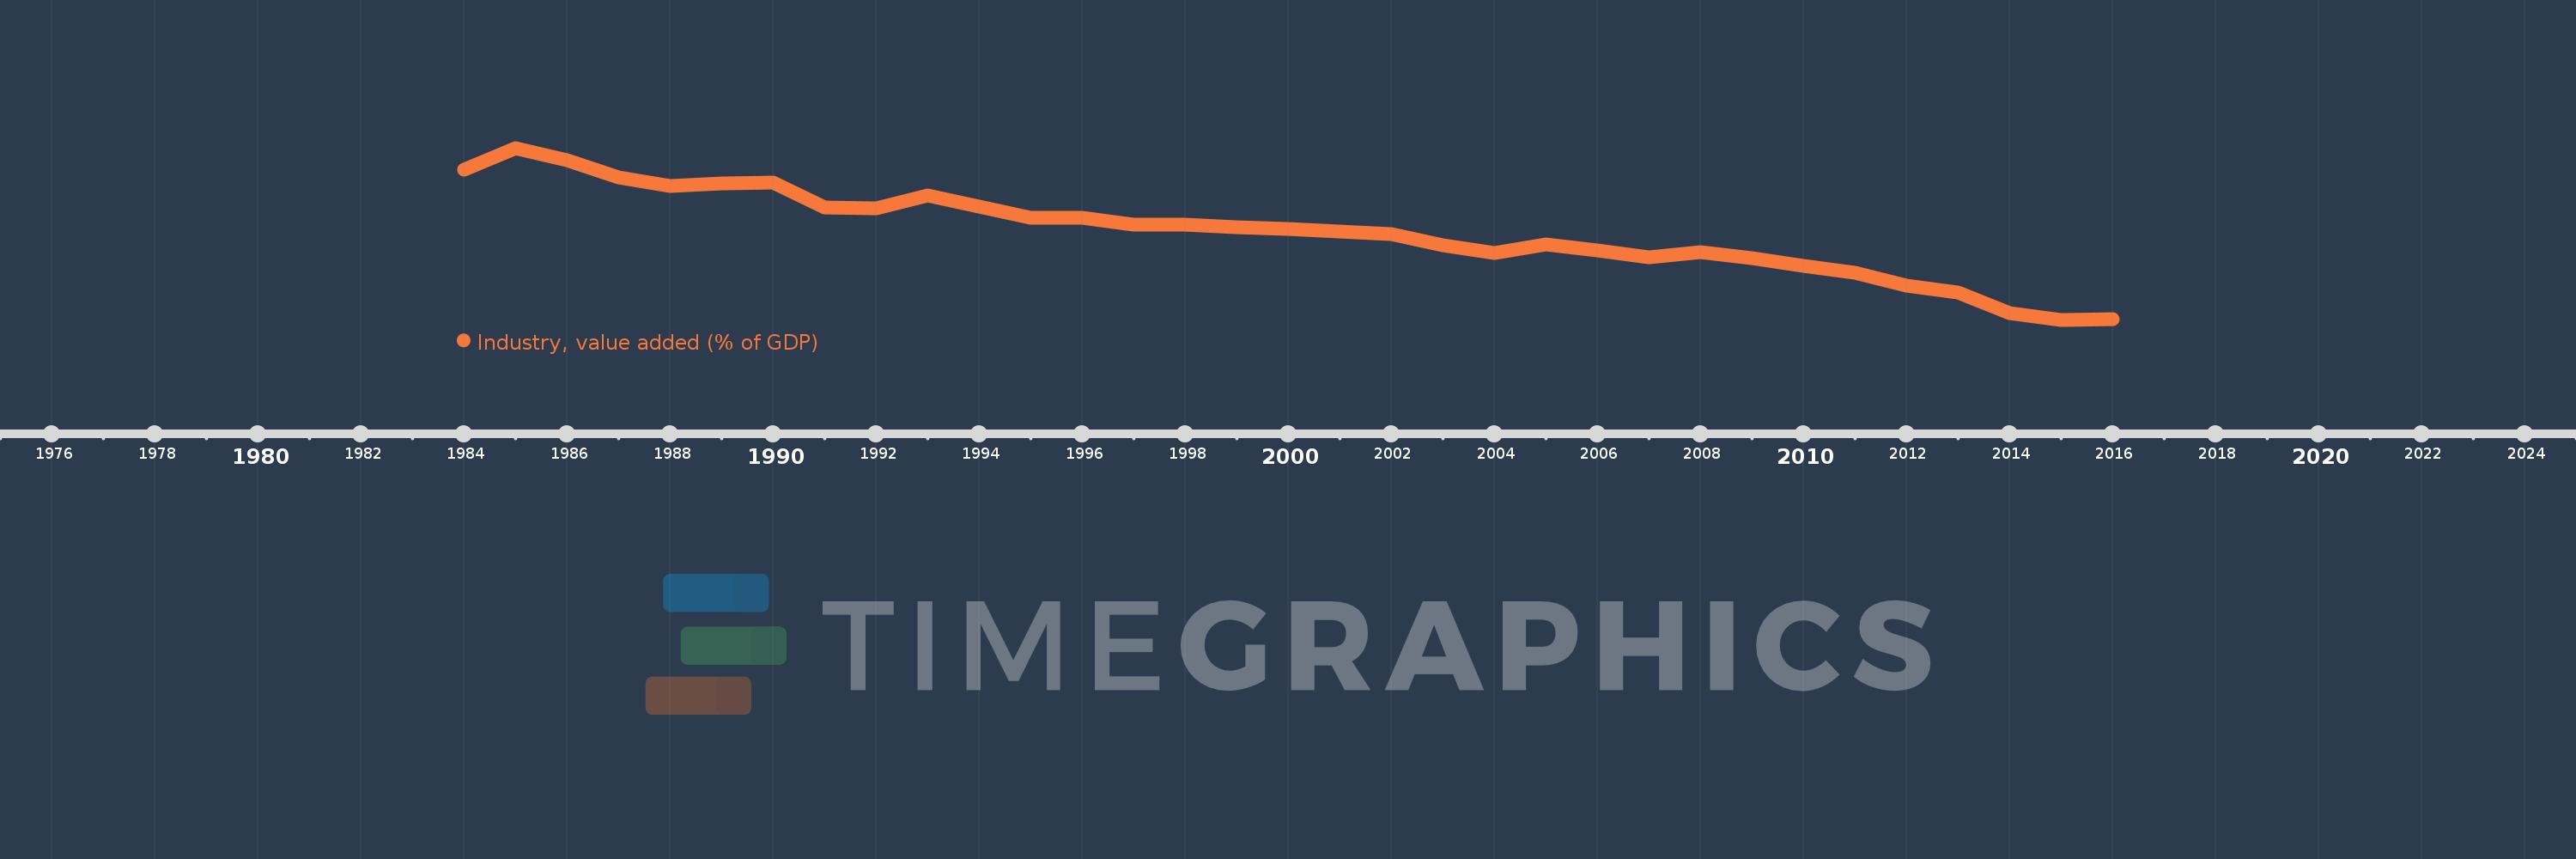
Industry, value added (% of GDP)
2016,2015,2014,2013,2012,2011,2010,2009,2008,2007,2006,2005,2004,2003,2002,2001,2000,1999,1998,1997,1996,1995,1994,1993,1992,1991,1990,1989,1988,1987,1986,1985,1984
This statistics in other country:
AfghanistanAlbaniaAlgeriaAndorraAngolaAntigua and BarbudaArab WorldArgentinaArmeniaArubaAustraliaAustriaAzerbaijanBahamas, TheBahrainBangladeshBarbadosBelarusBelgiumBelizeBeninBermudaBhutanBoliviaBosnia and HerzegovinaBotswanaBrazilBrunei DarussalamBulgariaBurkina FasoBurundiCabo VerdeCambodiaCameroonCanadaCaribbean small statesCayman IslandsCentral African RepublicCentral Europe and the BalticsChadChileChinaColombiaComorosCongo, Dem. Rep.Congo, Rep.Costa RicaCote d'IvoireCroatiaCubaCyprusCzech RepublicDenmarkDjiboutiDominicaDominican RepublicEarly-demographic dividendEast Asia & PacificEast Asia & Pacific (excluding high income)East Asia & Pacific (IDA & IBRD countries)EcuadorEgypt, Arab Rep.El SalvadorEquatorial GuineaEritreaEstoniaEthiopiaEuro areaEurope & Central AsiaEurope & Central Asia (excluding high income)Europe & Central Asia (IDA & IBRD countries)European UnionFijiFinlandFragile and conflict affected situationsFranceGabonGambia, TheGeorgiaGermanyGhanaGreeceGrenadaGuatemalaGuineaGuinea-BissauGuyanaHeavily indebted poor countries (HIPC)High incomeHondurasHong Kong SAR, ChinaHungaryIBRD onlyIcelandIDA & IBRD totalIDA blendIDA onlyIDA totalIndiaIndonesiaIran, Islamic Rep.IrelandItalyJamaicaJapanJordanKazakhstanKenyaKiribatiKorea, Rep.KosovoKuwaitKyrgyz RepublicLao PDRLate-demographic dividendLatin America & Caribbean Latin America & Caribbean (excluding high income)Latin America & the Caribbean (IDA & IBRD countries)LatviaLeast developed countries: UN classificationLebanonLesothoLibyaLiechtensteinLithuaniaLow & middle incomeLow incomeLower middle incomeLuxembourgMacao SAR, ChinaMacedonia, FYRMadagascarMalawiMalaysiaMaldivesMaliMaltaMarshall IslandsMauritaniaMauritiusMexicoMicronesia, Fed. Sts.Middle East & North AfricaMiddle East & North Africa (excluding high income)Middle East & North Africa (IDA & IBRD countries)Middle incomeMoldovaMongoliaMontenegroMoroccoMozambiqueMyanmarNamibiaNepalNetherlandsNew CaledoniaNew ZealandNicaraguaNigerNigeriaNorth AmericaNorwayOECD membersOmanOther small statesPacific island small statesPakistanPalauPanamaPapua New GuineaParaguayPeruPhilippinesPolandPortugalPost-demographic dividendPre-demographic dividendPuerto RicoQatarRomaniaRussian FederationRwandaSao Tome and PrincipeSaudi ArabiaSenegalSerbiaSeychellesSierra LeoneSingaporeSlovak RepublicSloveniaSmall statesSolomon IslandsSomaliaSouth AfricaSouth AsiaSouth Asia (IDA & IBRD)SpainSri LankaSt. Kitts and NevisSt. LuciaSt. Vincent and the GrenadinesSub-Saharan Africa Sub-Saharan Africa (excluding high income)Sub-Saharan Africa (IDA & IBRD countries)SudanSurinameSwazilandSwedenSwitzerlandSyrian Arab RepublicTajikistanTanzaniaThailandTimor-LesteTogoTongaTrinidad and TobagoTunisiaTurkeyTurkmenistanTuvaluUgandaUkraineUnited KingdomUnited StatesUpper middle incomeUruguayUzbekistanVanuatuVenezuela, RBVietnamWest Bank and GazaWorldYemen, Rep.ZambiaZimbabwe Timeline:
This timeline shows a graph from 1984 to 2016 of Costa Rica. No data until 1983. Number of actual observations by date: 33.
Source name:
World Development Indicators
Source organization:
World Bank national accounts data, and OECD National Accounts data files.
Categories, topics:
Economy & Growth
Last updated:
apr 23, 2017
Indicators value changes by year
Maximum:
33.978
jan 1, 1985
At the date of observation
Value
Absolute change
Change from previous value
jan 1, 1984
32.48
+32.48
0.0%
jan 1, 1985
33.978
+1.498
4.61%
jan 1, 1986
33.102
-0.876
-2.58%
jan 1, 1987
31.929
-1.172
-3.54%
jan 1, 1988
31.34
-0.589
-1.84%
jan 1, 1989
31.531
+0.19
0.61%
jan 1, 1990
31.595
+0.064
0.2%
jan 1, 1991
29.892
-1.702
-5.39%
jan 1, 1992
29.839
-0.053
-0.18%
jan 1, 1993
30.707
+0.868
2.91%
jan 1, 1994
29.902
-0.806
-2.62%
jan 1, 1995
29.146
-0.756
-2.53%
jan 1, 1996
29.165
+0.019
0.07%
jan 1, 1997
28.679
-0.487
-1.67%
jan 1, 1998
28.694
+0.015
0.05%
jan 1, 1999
28.534
-0.16
-0.56%
jan 1, 2000
28.376
-0.158
-0.55%
jan 1, 2001
28.223
-0.153
-0.54%
jan 1, 2002
28.046
-0.177
-0.63%
jan 1, 2003
27.288
-0.759
-2.7%
jan 1, 2004
26.755
-0.533
-1.95%
jan 1, 2005
27.291
+0.536
2.0%
jan 1, 2006
26.893
-0.398
-1.46%
jan 1, 2007
26.401
-0.492
-1.83%
jan 1, 2008
26.761
+0.36
1.36%
jan 1, 2009
26.353
-0.408
-1.52%
jan 1, 2010
25.818
-0.535
-2.03%
jan 1, 2011
25.363
-0.456
-1.77%
jan 1, 2012
24.455
-0.908
-3.58%
jan 1, 2013
23.975
-0.48
-1.96%
jan 1, 2014
22.606
-1.369
-5.71%
jan 1, 2015
22.12
-0.487
-2.15%
jan 1, 2016
22.187
+0.067
0.3%
Ranking of countries by current statistics by years


Comments: