29
/
en
AIzaSyAYiBZKx7MnpbEhh9jyipgxe19OcubqV5w
April 1, 2024
177800
Lesotho
LSO
true
2
1
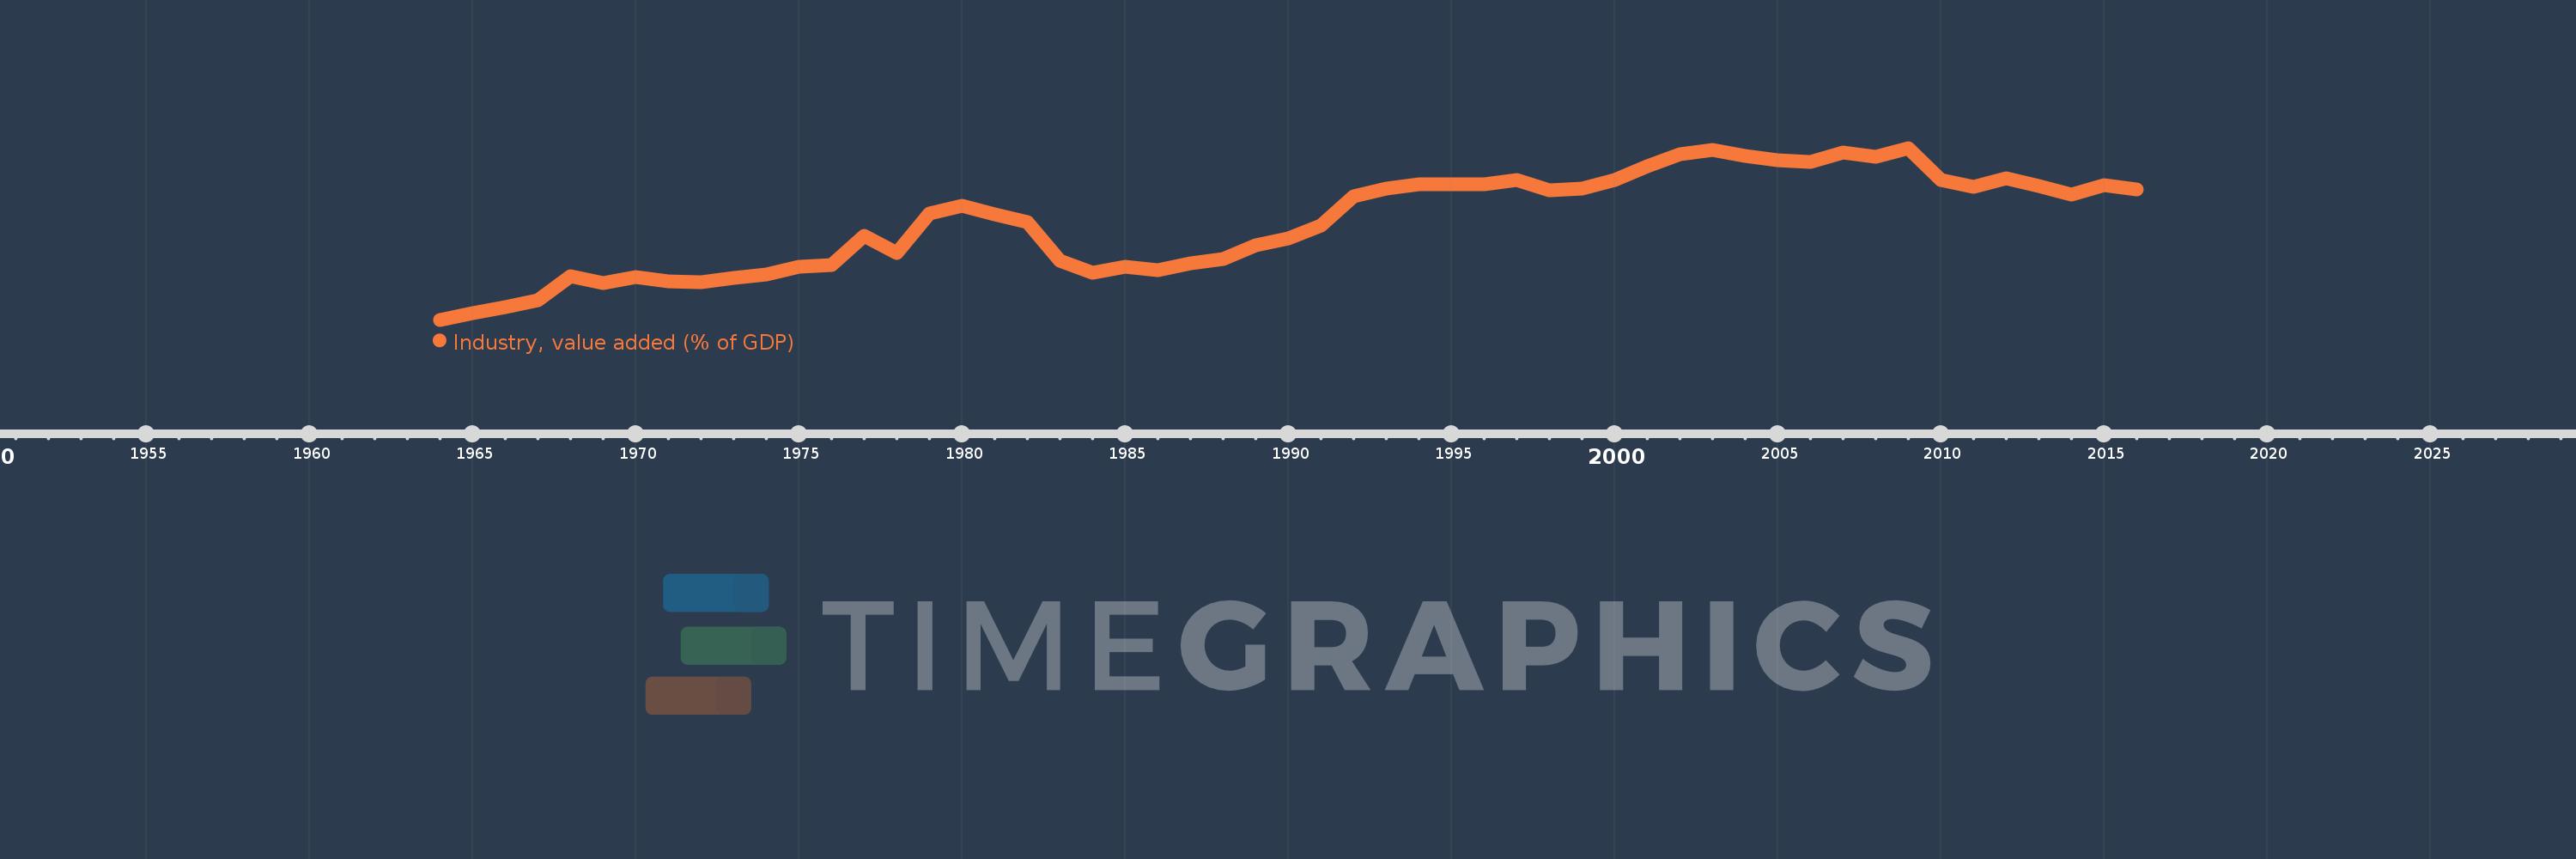
Industry, value added (% of GDP)
2016,2015,2014,2013,2012,2011,2010,2009,2008,2007,2006,2005,2004,2003,2002,2001,2000,1999,1998,1997,1996,1995,1994,1993,1992,1991,1990,1989,1988,1987,1986,1985,1984,1983,1982,1981,1980,1979,1978,1977,1976,1975,1974,1973,1972,1971,1970,1969,1968,1967,1966,1965,1964
This statistics in other country:
AfghanistanAlbaniaAlgeriaAndorraAngolaAntigua and BarbudaArab WorldArgentinaArmeniaArubaAustraliaAustriaAzerbaijanBahamas, TheBahrainBangladeshBarbadosBelarusBelgiumBelizeBeninBermudaBhutanBoliviaBosnia and HerzegovinaBotswanaBrazilBrunei DarussalamBulgariaBurkina FasoBurundiCabo VerdeCambodiaCameroonCanadaCaribbean small statesCayman IslandsCentral African RepublicCentral Europe and the BalticsChadChileChinaColombiaComorosCongo, Dem. Rep.Congo, Rep.Costa RicaCote d'IvoireCroatiaCubaCyprusCzech RepublicDenmarkDjiboutiDominicaDominican RepublicEarly-demographic dividendEast Asia & PacificEast Asia & Pacific (excluding high income)East Asia & Pacific (IDA & IBRD countries)EcuadorEgypt, Arab Rep.El SalvadorEquatorial GuineaEritreaEstoniaEthiopiaEuro areaEurope & Central AsiaEurope & Central Asia (excluding high income)Europe & Central Asia (IDA & IBRD countries)European UnionFijiFinlandFragile and conflict affected situationsFranceGabonGambia, TheGeorgiaGermanyGhanaGreeceGrenadaGuatemalaGuineaGuinea-BissauGuyanaHeavily indebted poor countries (HIPC)High incomeHondurasHong Kong SAR, ChinaHungaryIBRD onlyIcelandIDA & IBRD totalIDA blendIDA onlyIDA totalIndiaIndonesiaIran, Islamic Rep.IrelandItalyJamaicaJapanJordanKazakhstanKenyaKiribatiKorea, Rep.KosovoKuwaitKyrgyz RepublicLao PDRLate-demographic dividendLatin America & Caribbean Latin America & Caribbean (excluding high income)Latin America & the Caribbean (IDA & IBRD countries)LatviaLeast developed countries: UN classificationLebanonLesothoLibyaLiechtensteinLithuaniaLow & middle incomeLow incomeLower middle incomeLuxembourgMacao SAR, ChinaMacedonia, FYRMadagascarMalawiMalaysiaMaldivesMaliMaltaMarshall IslandsMauritaniaMauritiusMexicoMicronesia, Fed. Sts.Middle East & North AfricaMiddle East & North Africa (excluding high income)Middle East & North Africa (IDA & IBRD countries)Middle incomeMoldovaMongoliaMontenegroMoroccoMozambiqueMyanmarNamibiaNepalNetherlandsNew CaledoniaNew ZealandNicaraguaNigerNigeriaNorth AmericaNorwayOECD membersOmanOther small statesPacific island small statesPakistanPalauPanamaPapua New GuineaParaguayPeruPhilippinesPolandPortugalPost-demographic dividendPre-demographic dividendPuerto RicoQatarRomaniaRussian FederationRwandaSao Tome and PrincipeSaudi ArabiaSenegalSerbiaSeychellesSierra LeoneSingaporeSlovak RepublicSloveniaSmall statesSolomon IslandsSomaliaSouth AfricaSouth AsiaSouth Asia (IDA & IBRD)SpainSri LankaSt. Kitts and NevisSt. LuciaSt. Vincent and the GrenadinesSub-Saharan Africa Sub-Saharan Africa (excluding high income)Sub-Saharan Africa (IDA & IBRD countries)SudanSurinameSwazilandSwedenSwitzerlandSyrian Arab RepublicTajikistanTanzaniaThailandTimor-LesteTogoTongaTrinidad and TobagoTunisiaTurkeyTurkmenistanTuvaluUgandaUkraineUnited KingdomUnited StatesUpper middle incomeUruguayUzbekistanVanuatuVenezuela, RBVietnamWest Bank and GazaWorldYemen, Rep.ZambiaZimbabwe Timeline:
This timeline shows a graph from 1964 to 2016 of Lesotho. No data until 1963. Number of actual observations by date: 53.
Source name:
World Development Indicators
Source organization:
World Bank national accounts data, and OECD National Accounts data files.
Categories, topics:
Economy & Growth
Last updated:
apr 23, 2017
Indicators value changes by year
Maximum:
41.507
jan 1, 2009
At the date of observation
Value
Absolute change
Change from previous value
jan 1, 1964
2.531
+2.531
0.0%
jan 1, 1965
3.972
+1.441
56.93%
jan 1, 1966
5.464
+1.492
37.57%
jan 1, 1967
7.041
+1.577
28.86%
jan 1, 1968
12.448
+5.407
76.8%
jan 1, 1969
10.893
-1.555
-12.49%
jan 1, 1970
12.289
+1.396
12.82%
jan 1, 1971
11.251
-1.038
-8.45%
jan 1, 1972
11.059
-0.191
-1.7%
jan 1, 1973
11.95
+0.891
8.06%
jan 1, 1974
12.873
+0.922
7.72%
jan 1, 1975
14.496
+1.623
12.61%
jan 1, 1976
15.036
+0.54
3.73%
jan 1, 1977
21.591
+6.555
43.6%
jan 1, 1978
17.599
-3.992
-18.49%
jan 1, 1979
26.623
+9.024
51.27%
jan 1, 1980
28.448
+1.825
6.86%
jan 1, 1981
26.53
-1.918
-6.74%
jan 1, 1982
24.634
-1.895
-7.14%
jan 1, 1983
15.964
-8.671
-35.2%
jan 1, 1984
13.193
-2.771
-17.36%
jan 1, 1985
14.48
+1.288
9.76%
jan 1, 1986
13.736
-0.745
-5.14%
jan 1, 1987
15.418
+1.682
12.25%
jan 1, 1988
16.262
+0.843
5.47%
jan 1, 1989
19.474
+3.213
19.76%
jan 1, 1990
20.898
+1.424
7.31%
jan 1, 1991
23.875
+2.978
14.25%
jan 1, 1992
30.593
+6.718
28.14%
jan 1, 1993
32.256
+1.663
5.44%
jan 1, 1994
33.197
+0.941
2.92%
jan 1, 1995
33.355
+0.158
0.48%
jan 1, 1996
33.258
-0.097
-0.29%
jan 1, 1997
34.262
+1.004
3.02%
jan 1, 1998
31.851
-2.411
-7.04%
jan 1, 1999
32.348
+0.496
1.56%
jan 1, 2000
34.181
+1.833
5.67%
jan 1, 2001
37.286
+3.105
9.08%
jan 1, 2002
40.177
+2.891
7.75%
jan 1, 2003
41.082
+0.905
2.25%
jan 1, 2004
39.619
-1.464
-3.56%
jan 1, 2005
38.797
-0.822
-2.07%
jan 1, 2006
38.237
-0.561
-1.44%
jan 1, 2007
40.422
+2.185
5.72%
jan 1, 2008
39.524
-0.898
-2.22%
jan 1, 2009
41.507
+1.983
5.02%
jan 1, 2010
34.184
-7.323
-17.64%
jan 1, 2011
32.727
-1.457
-4.26%
jan 1, 2012
34.554
+1.827
5.58%
jan 1, 2013
32.78
-1.774
-5.13%
jan 1, 2014
30.91
-1.87
-5.71%
jan 1, 2015
33.023
+2.114
6.84%
jan 1, 2016
32.048
-0.975
-2.95%
Ranking of countries by current statistics by years


Comments: