29
/
en
AIzaSyAYiBZKx7MnpbEhh9jyipgxe19OcubqV5w
April 1, 2024
264748
Togo
TGO
true
2
1
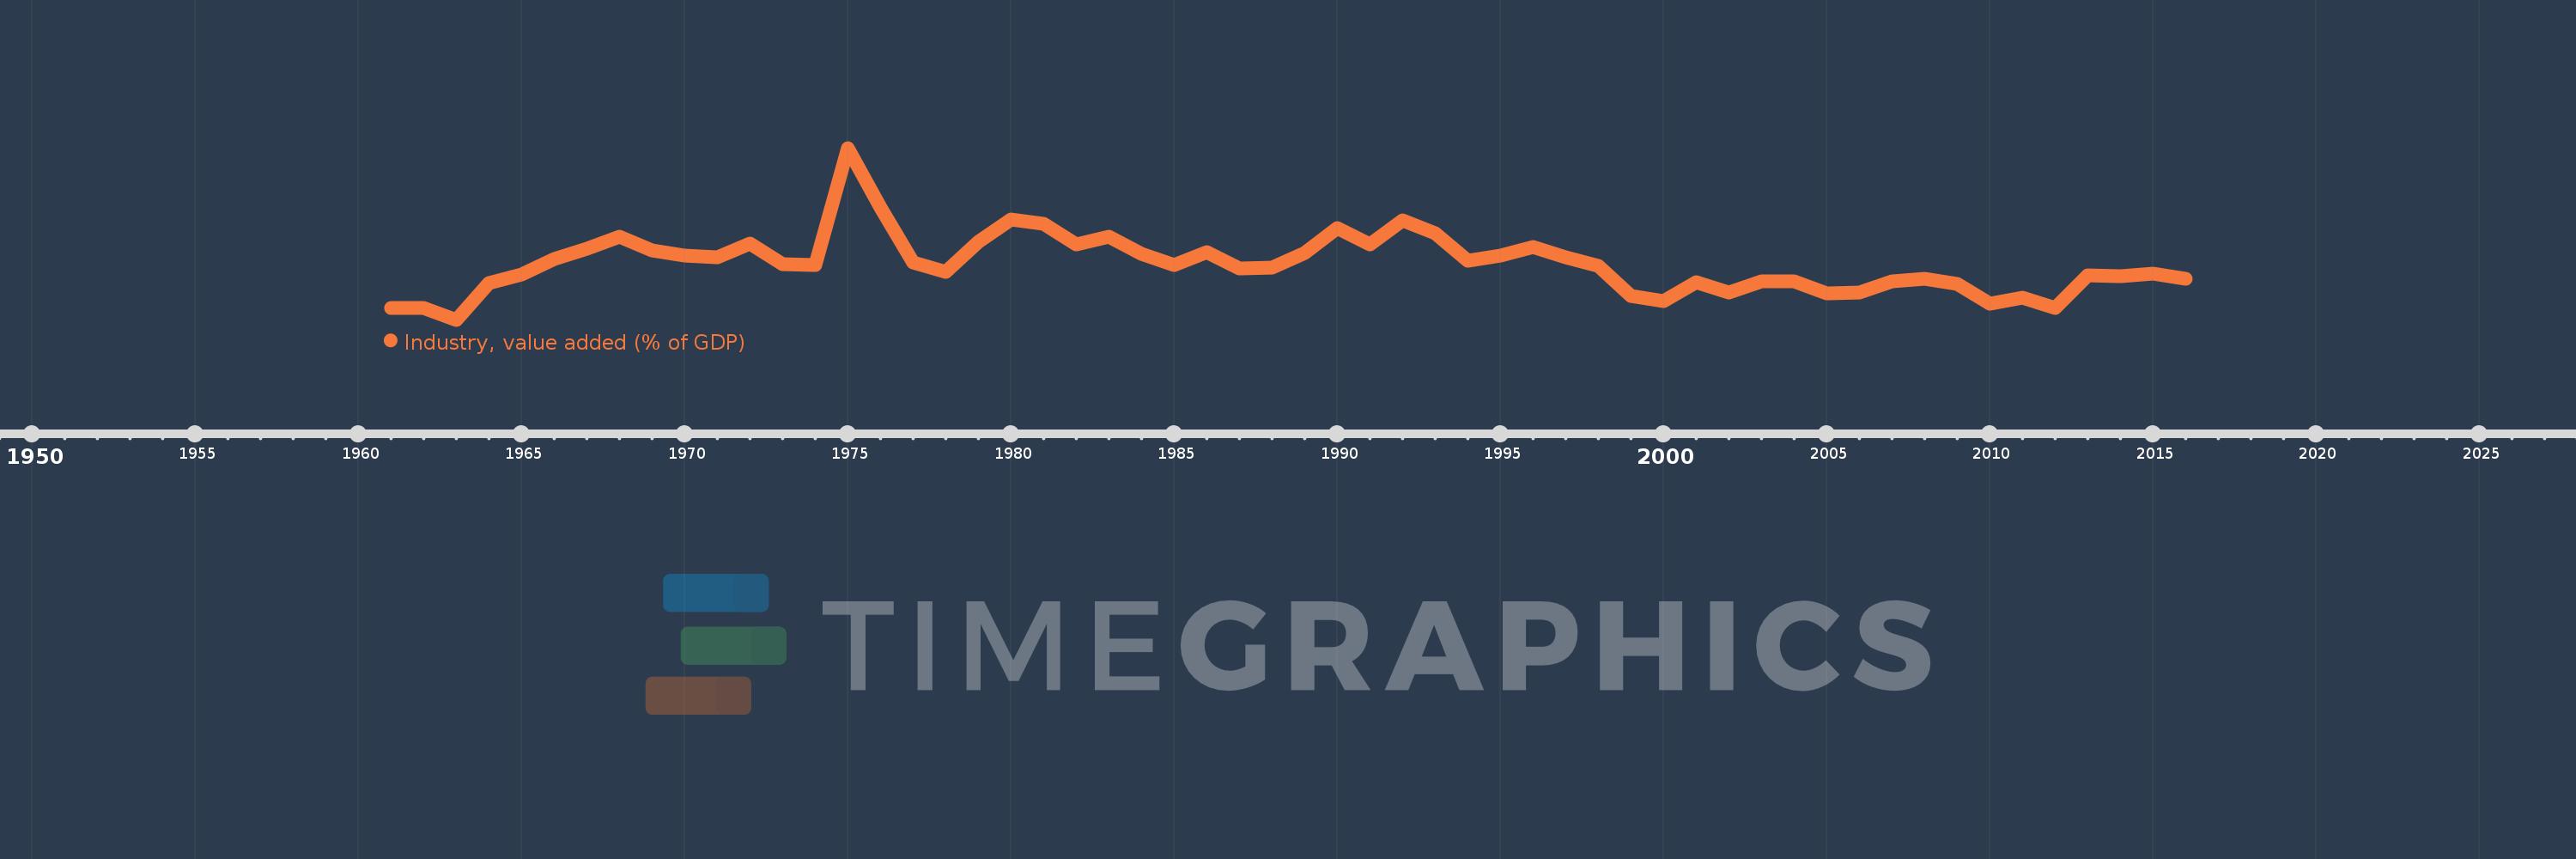
Industry, value added (% of GDP)
2016,2015,2014,2013,2012,2011,2010,2009,2008,2007,2006,2005,2004,2003,2002,2001,2000,1999,1998,1997,1996,1995,1994,1993,1992,1991,1990,1989,1988,1987,1986,1985,1984,1983,1982,1981,1980,1979,1978,1977,1976,1975,1974,1973,1972,1971,1970,1969,1968,1967,1966,1965,1964,1963,1962,1961
This statistics in other country:
AfghanistanAlbaniaAlgeriaAndorraAngolaAntigua and BarbudaArab WorldArgentinaArmeniaArubaAustraliaAustriaAzerbaijanBahamas, TheBahrainBangladeshBarbadosBelarusBelgiumBelizeBeninBermudaBhutanBoliviaBosnia and HerzegovinaBotswanaBrazilBrunei DarussalamBulgariaBurkina FasoBurundiCabo VerdeCambodiaCameroonCanadaCaribbean small statesCayman IslandsCentral African RepublicCentral Europe and the BalticsChadChileChinaColombiaComorosCongo, Dem. Rep.Congo, Rep.Costa RicaCote d'IvoireCroatiaCubaCyprusCzech RepublicDenmarkDjiboutiDominicaDominican RepublicEarly-demographic dividendEast Asia & PacificEast Asia & Pacific (excluding high income)East Asia & Pacific (IDA & IBRD countries)EcuadorEgypt, Arab Rep.El SalvadorEquatorial GuineaEritreaEstoniaEthiopiaEuro areaEurope & Central AsiaEurope & Central Asia (excluding high income)Europe & Central Asia (IDA & IBRD countries)European UnionFijiFinlandFragile and conflict affected situationsFranceGabonGambia, TheGeorgiaGermanyGhanaGreeceGrenadaGuatemalaGuineaGuinea-BissauGuyanaHeavily indebted poor countries (HIPC)High incomeHondurasHong Kong SAR, ChinaHungaryIBRD onlyIcelandIDA & IBRD totalIDA blendIDA onlyIDA totalIndiaIndonesiaIran, Islamic Rep.IrelandItalyJamaicaJapanJordanKazakhstanKenyaKiribatiKorea, Rep.KosovoKuwaitKyrgyz RepublicLao PDRLate-demographic dividendLatin America & Caribbean Latin America & Caribbean (excluding high income)Latin America & the Caribbean (IDA & IBRD countries)LatviaLeast developed countries: UN classificationLebanonLesothoLibyaLiechtensteinLithuaniaLow & middle incomeLow incomeLower middle incomeLuxembourgMacao SAR, ChinaMacedonia, FYRMadagascarMalawiMalaysiaMaldivesMaliMaltaMarshall IslandsMauritaniaMauritiusMexicoMicronesia, Fed. Sts.Middle East & North AfricaMiddle East & North Africa (excluding high income)Middle East & North Africa (IDA & IBRD countries)Middle incomeMoldovaMongoliaMontenegroMoroccoMozambiqueMyanmarNamibiaNepalNetherlandsNew CaledoniaNew ZealandNicaraguaNigerNigeriaNorth AmericaNorwayOECD membersOmanOther small statesPacific island small statesPakistanPalauPanamaPapua New GuineaParaguayPeruPhilippinesPolandPortugalPost-demographic dividendPre-demographic dividendPuerto RicoQatarRomaniaRussian FederationRwandaSao Tome and PrincipeSaudi ArabiaSenegalSerbiaSeychellesSierra LeoneSingaporeSlovak RepublicSloveniaSmall statesSolomon IslandsSomaliaSouth AfricaSouth AsiaSouth Asia (IDA & IBRD)SpainSri LankaSt. Kitts and NevisSt. LuciaSt. Vincent and the GrenadinesSub-Saharan Africa Sub-Saharan Africa (excluding high income)Sub-Saharan Africa (IDA & IBRD countries)SudanSurinameSwazilandSwedenSwitzerlandSyrian Arab RepublicTajikistanTanzaniaThailandTimor-LesteTogoTongaTrinidad and TobagoTunisiaTurkeyTurkmenistanTuvaluUgandaUkraineUnited KingdomUnited StatesUpper middle incomeUruguayUzbekistanVanuatuVenezuela, RBVietnamWest Bank and GazaWorldYemen, Rep.ZambiaZimbabwe Timeline:
This timeline shows a graph from 1961 to 2016 of Togo. No data until 1960. Number of actual observations by date: 56.
Source name:
World Development Indicators
Source organization:
World Bank national accounts data, and OECD National Accounts data files.
Categories, topics:
Economy & Growth
Last updated:
apr 23, 2017
Indicators value changes by year
Minimum:
14.198
jan 1, 1963
Maximum:
33.136
jan 1, 1975
At the date of observation
Value
Absolute change
Change from previous value
jan 1, 1961
15.488
+15.488
0.0%
jan 1, 1962
15.484
-0.004
-0.03%
jan 1, 1963
14.198
-1.286
-8.31%
jan 1, 1964
18.234
+4.036
28.43%
jan 1, 1965
19.165
+0.931
5.11%
jan 1, 1966
20.915
+1.75
9.13%
jan 1, 1967
22.034
+1.119
5.35%
jan 1, 1968
23.333
+1.299
5.9%
jan 1, 1969
21.87
-1.464
-6.27%
jan 1, 1970
21.264
-0.605
-2.77%
jan 1, 1971
21.083
-0.182
-0.85%
jan 1, 1972
22.56
+1.478
7.01%
jan 1, 1973
20.331
-2.229
-9.88%
jan 1, 1974
20.199
-0.132
-0.65%
jan 1, 1975
33.136
+12.937
64.05%
jan 1, 1976
26.531
-6.605
-19.93%
jan 1, 1977
20.473
-6.058
-22.83%
jan 1, 1978
19.476
-0.997
-4.87%
jan 1, 1979
22.796
+3.319
17.04%
jan 1, 1980
25.25
+2.455
10.77%
jan 1, 1981
24.781
-0.469
-1.86%
jan 1, 1982
22.486
-2.296
-9.26%
jan 1, 1983
23.37
+0.885
3.93%
jan 1, 1984
21.419
-1.952
-8.35%
jan 1, 1985
20.204
-1.215
-5.67%
jan 1, 1986
21.664
+1.46
7.23%
jan 1, 1987
19.869
-1.795
-8.28%
jan 1, 1988
19.979
+0.109
0.55%
jan 1, 1989
21.549
+1.571
7.86%
jan 1, 1990
24.319
+2.77
12.85%
jan 1, 1991
22.529
-1.79
-7.36%
jan 1, 1992
25.156
+2.627
11.66%
jan 1, 1993
23.773
-1.383
-5.5%
jan 1, 1994
20.677
-3.096
-13.02%
jan 1, 1995
21.228
+0.551
2.66%
jan 1, 1996
22.181
+0.953
4.49%
jan 1, 1997
21.06
-1.12
-5.05%
jan 1, 1998
20.123
-0.937
-4.45%
jan 1, 1999
16.861
-3.262
-16.21%
jan 1, 2000
16.21
-0.652
-3.86%
jan 1, 2001
18.319
+2.11
13.01%
jan 1, 2002
17.154
-1.166
-6.36%
jan 1, 2003
18.393
+1.239
7.22%
jan 1, 2004
18.411
+0.018
0.1%
jan 1, 2005
17.147
-1.264
-6.87%
jan 1, 2006
17.19
+0.043
0.25%
jan 1, 2007
18.423
+1.233
7.18%
jan 1, 2008
18.689
+0.266
1.44%
jan 1, 2009
18.174
-0.516
-2.76%
jan 1, 2010
15.983
-2.19
-12.05%
jan 1, 2011
16.633
+0.65
4.07%
jan 1, 2012
15.54
-1.093
-6.57%
jan 1, 2013
19.063
+3.523
22.67%
jan 1, 2014
18.984
-0.079
-0.41%
jan 1, 2015
19.255
+0.271
1.43%
jan 1, 2016
18.671
-0.584
-3.03%
Ranking of countries by current statistics by years


Comments: