29
/
en
AIzaSyAYiBZKx7MnpbEhh9jyipgxe19OcubqV5w
April 1, 2024
265894
Tonga
TON
true
2
1
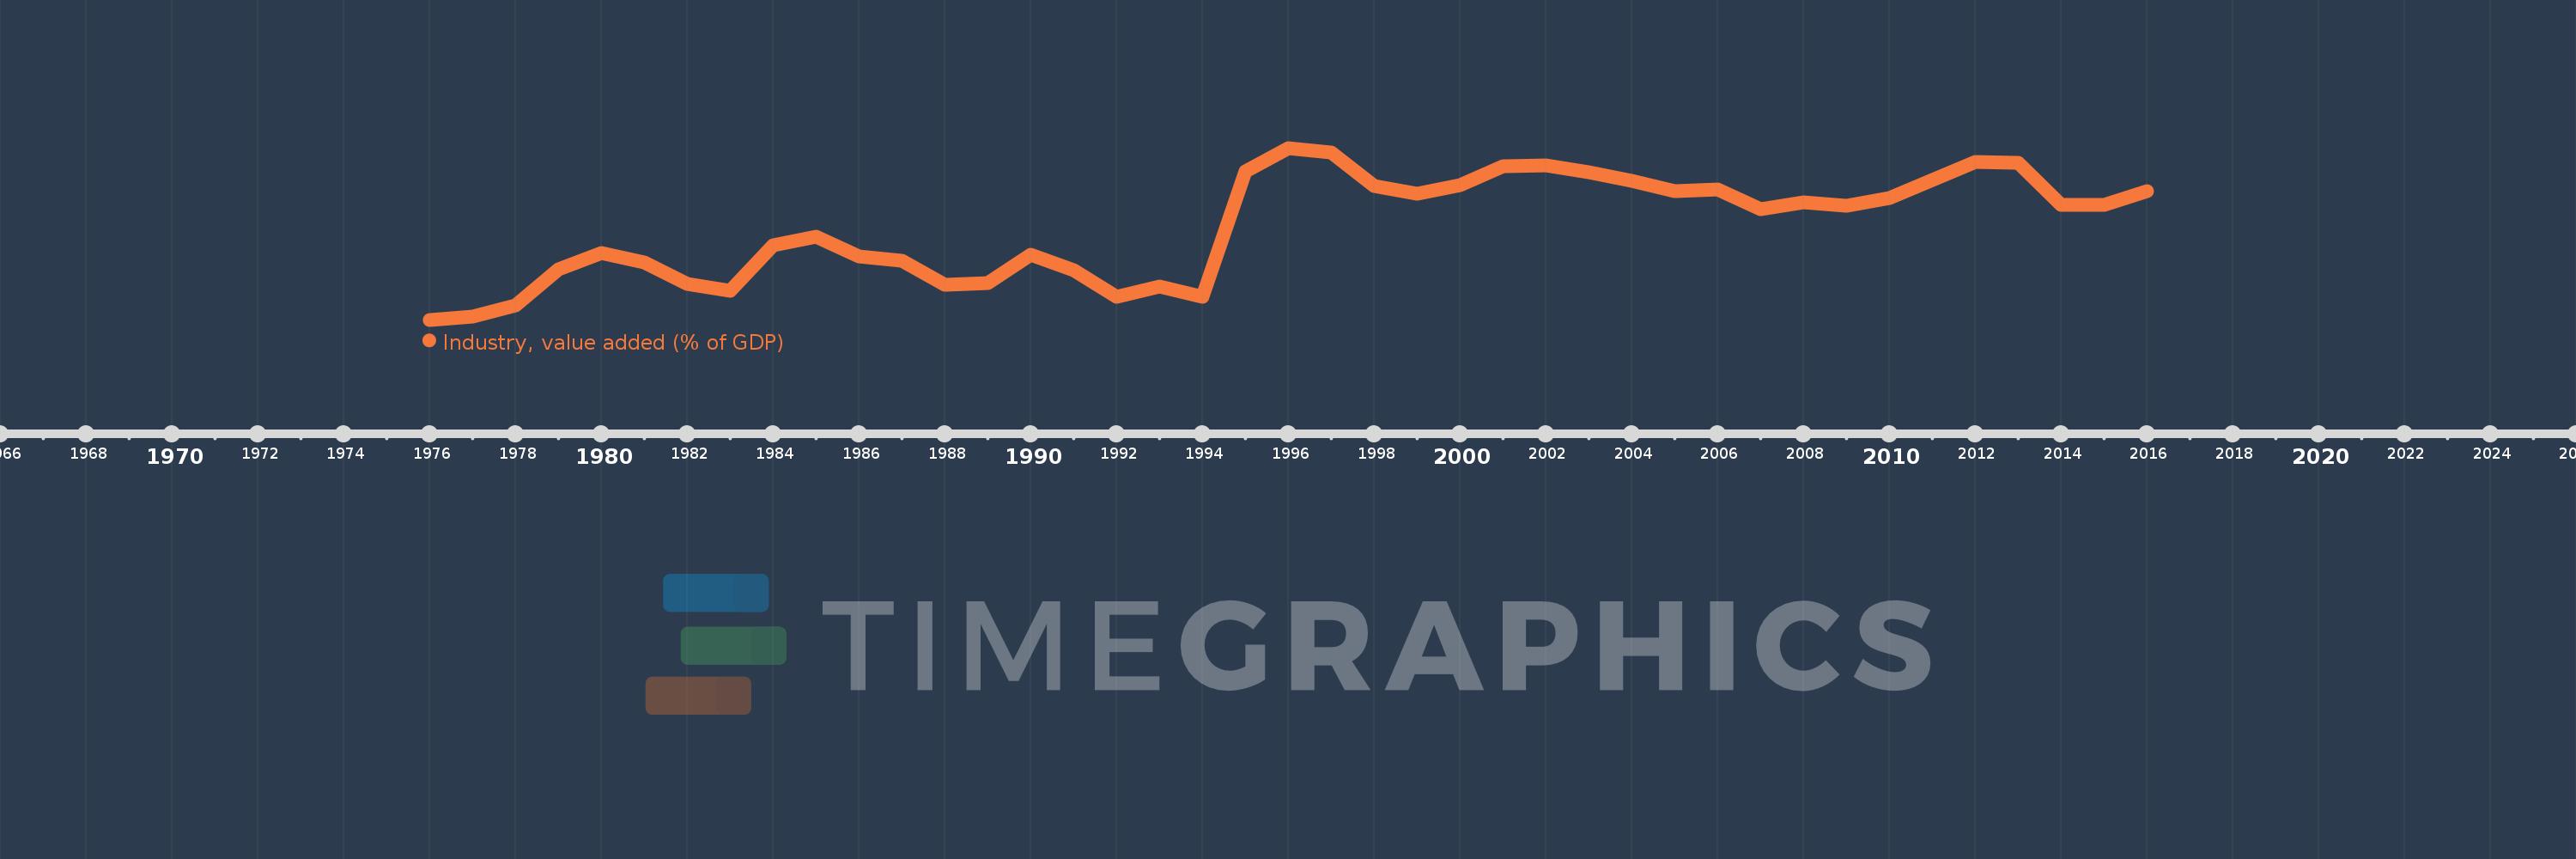
Industry, value added (% of GDP)
2016,2015,2014,2013,2012,2011,2010,2009,2008,2007,2006,2005,2004,2003,2002,2001,2000,1999,1998,1997,1996,1995,1994,1993,1992,1991,1990,1989,1988,1987,1986,1985,1984,1983,1982,1981,1980,1979,1978,1977,1976
This statistics in other country:
AfghanistanAlbaniaAlgeriaAndorraAngolaAntigua and BarbudaArab WorldArgentinaArmeniaArubaAustraliaAustriaAzerbaijanBahamas, TheBahrainBangladeshBarbadosBelarusBelgiumBelizeBeninBermudaBhutanBoliviaBosnia and HerzegovinaBotswanaBrazilBrunei DarussalamBulgariaBurkina FasoBurundiCabo VerdeCambodiaCameroonCanadaCaribbean small statesCayman IslandsCentral African RepublicCentral Europe and the BalticsChadChileChinaColombiaComorosCongo, Dem. Rep.Congo, Rep.Costa RicaCote d'IvoireCroatiaCubaCyprusCzech RepublicDenmarkDjiboutiDominicaDominican RepublicEarly-demographic dividendEast Asia & PacificEast Asia & Pacific (excluding high income)East Asia & Pacific (IDA & IBRD countries)EcuadorEgypt, Arab Rep.El SalvadorEquatorial GuineaEritreaEstoniaEthiopiaEuro areaEurope & Central AsiaEurope & Central Asia (excluding high income)Europe & Central Asia (IDA & IBRD countries)European UnionFijiFinlandFragile and conflict affected situationsFranceGabonGambia, TheGeorgiaGermanyGhanaGreeceGrenadaGuatemalaGuineaGuinea-BissauGuyanaHeavily indebted poor countries (HIPC)High incomeHondurasHong Kong SAR, ChinaHungaryIBRD onlyIcelandIDA & IBRD totalIDA blendIDA onlyIDA totalIndiaIndonesiaIran, Islamic Rep.IrelandItalyJamaicaJapanJordanKazakhstanKenyaKiribatiKorea, Rep.KosovoKuwaitKyrgyz RepublicLao PDRLate-demographic dividendLatin America & Caribbean Latin America & Caribbean (excluding high income)Latin America & the Caribbean (IDA & IBRD countries)LatviaLeast developed countries: UN classificationLebanonLesothoLibyaLiechtensteinLithuaniaLow & middle incomeLow incomeLower middle incomeLuxembourgMacao SAR, ChinaMacedonia, FYRMadagascarMalawiMalaysiaMaldivesMaliMaltaMarshall IslandsMauritaniaMauritiusMexicoMicronesia, Fed. Sts.Middle East & North AfricaMiddle East & North Africa (excluding high income)Middle East & North Africa (IDA & IBRD countries)Middle incomeMoldovaMongoliaMontenegroMoroccoMozambiqueMyanmarNamibiaNepalNetherlandsNew CaledoniaNew ZealandNicaraguaNigerNigeriaNorth AmericaNorwayOECD membersOmanOther small statesPacific island small statesPakistanPalauPanamaPapua New GuineaParaguayPeruPhilippinesPolandPortugalPost-demographic dividendPre-demographic dividendPuerto RicoQatarRomaniaRussian FederationRwandaSao Tome and PrincipeSaudi ArabiaSenegalSerbiaSeychellesSierra LeoneSingaporeSlovak RepublicSloveniaSmall statesSolomon IslandsSomaliaSouth AfricaSouth AsiaSouth Asia (IDA & IBRD)SpainSri LankaSt. Kitts and NevisSt. LuciaSt. Vincent and the GrenadinesSub-Saharan Africa Sub-Saharan Africa (excluding high income)Sub-Saharan Africa (IDA & IBRD countries)SudanSurinameSwazilandSwedenSwitzerlandSyrian Arab RepublicTajikistanTanzaniaThailandTimor-LesteTogoTongaTrinidad and TobagoTunisiaTurkeyTurkmenistanTuvaluUgandaUkraineUnited KingdomUnited StatesUpper middle incomeUruguayUzbekistanVanuatuVenezuela, RBVietnamWest Bank and GazaWorldYemen, Rep.ZambiaZimbabwe Timeline:
This timeline shows a graph from 1976 to 2016 of Tonga. No data until 1975. Number of actual observations by date: 41.
Source name:
World Development Indicators
Source organization:
World Bank national accounts data, and OECD National Accounts data files.
Categories, topics:
Economy & Growth
Last updated:
apr 23, 2017
Indicators value changes by year
Minimum:
10.366
jan 1, 1976
Maximum:
22.623
jan 1, 1996
At the date of observation
Value
Absolute change
Change from previous value
jan 1, 1976
10.366
+10.366
0.0%
jan 1, 1977
10.571
+0.205
1.98%
jan 1, 1978
11.375
+0.804
7.61%
jan 1, 1979
13.983
+2.607
22.92%
jan 1, 1980
15.138
+1.155
8.26%
jan 1, 1981
14.45
-0.687
-4.54%
jan 1, 1982
12.933
-1.518
-10.5%
jan 1, 1983
12.415
-0.518
-4.01%
jan 1, 1984
15.688
+3.273
26.36%
jan 1, 1985
16.263
+0.576
3.67%
jan 1, 1986
14.9
-1.363
-8.38%
jan 1, 1987
14.583
-0.317
-2.13%
jan 1, 1988
12.851
-1.732
-11.87%
jan 1, 1989
12.966
+0.115
0.9%
jan 1, 1990
15.032
+2.065
15.93%
jan 1, 1991
13.932
-1.1
-7.32%
jan 1, 1992
12.009
-1.922
-13.8%
jan 1, 1993
12.717
+0.708
5.89%
jan 1, 1994
12.026
-0.691
-5.43%
jan 1, 1995
20.972
+8.946
74.39%
jan 1, 1996
22.623
+1.651
7.87%
jan 1, 1997
22.302
-0.321
-1.42%
jan 1, 1998
19.909
-2.393
-10.73%
jan 1, 1999
19.345
-0.564
-2.83%
jan 1, 2000
19.969
+0.624
3.23%
jan 1, 2001
21.288
+1.319
6.61%
jan 1, 2002
21.365
+0.076
0.36%
jan 1, 2003
20.87
-0.495
-2.31%
jan 1, 2004
20.304
-0.566
-2.71%
jan 1, 2005
19.542
-0.762
-3.75%
jan 1, 2006
19.667
+0.124
0.64%
jan 1, 2007
18.224
-1.442
-7.33%
jan 1, 2008
18.768
+0.543
2.98%
jan 1, 2009
18.521
-0.247
-1.31%
jan 1, 2010
19.052
+0.531
2.87%
jan 1, 2011
20.354
+1.302
6.83%
jan 1, 2012
21.605
+1.251
6.15%
jan 1, 2013
21.576
-0.029
-0.13%
jan 1, 2014
18.552
-3.025
-14.02%
jan 1, 2015
18.549
-0.002
-0.01%
jan 1, 2016
19.563
+1.014
5.47%
Ranking of countries by current statistics by years


Comments: