29
/
en
AIzaSyAYiBZKx7MnpbEhh9jyipgxe19OcubqV5w
April 1, 2024
150524
Honduras
HND
true
2
1
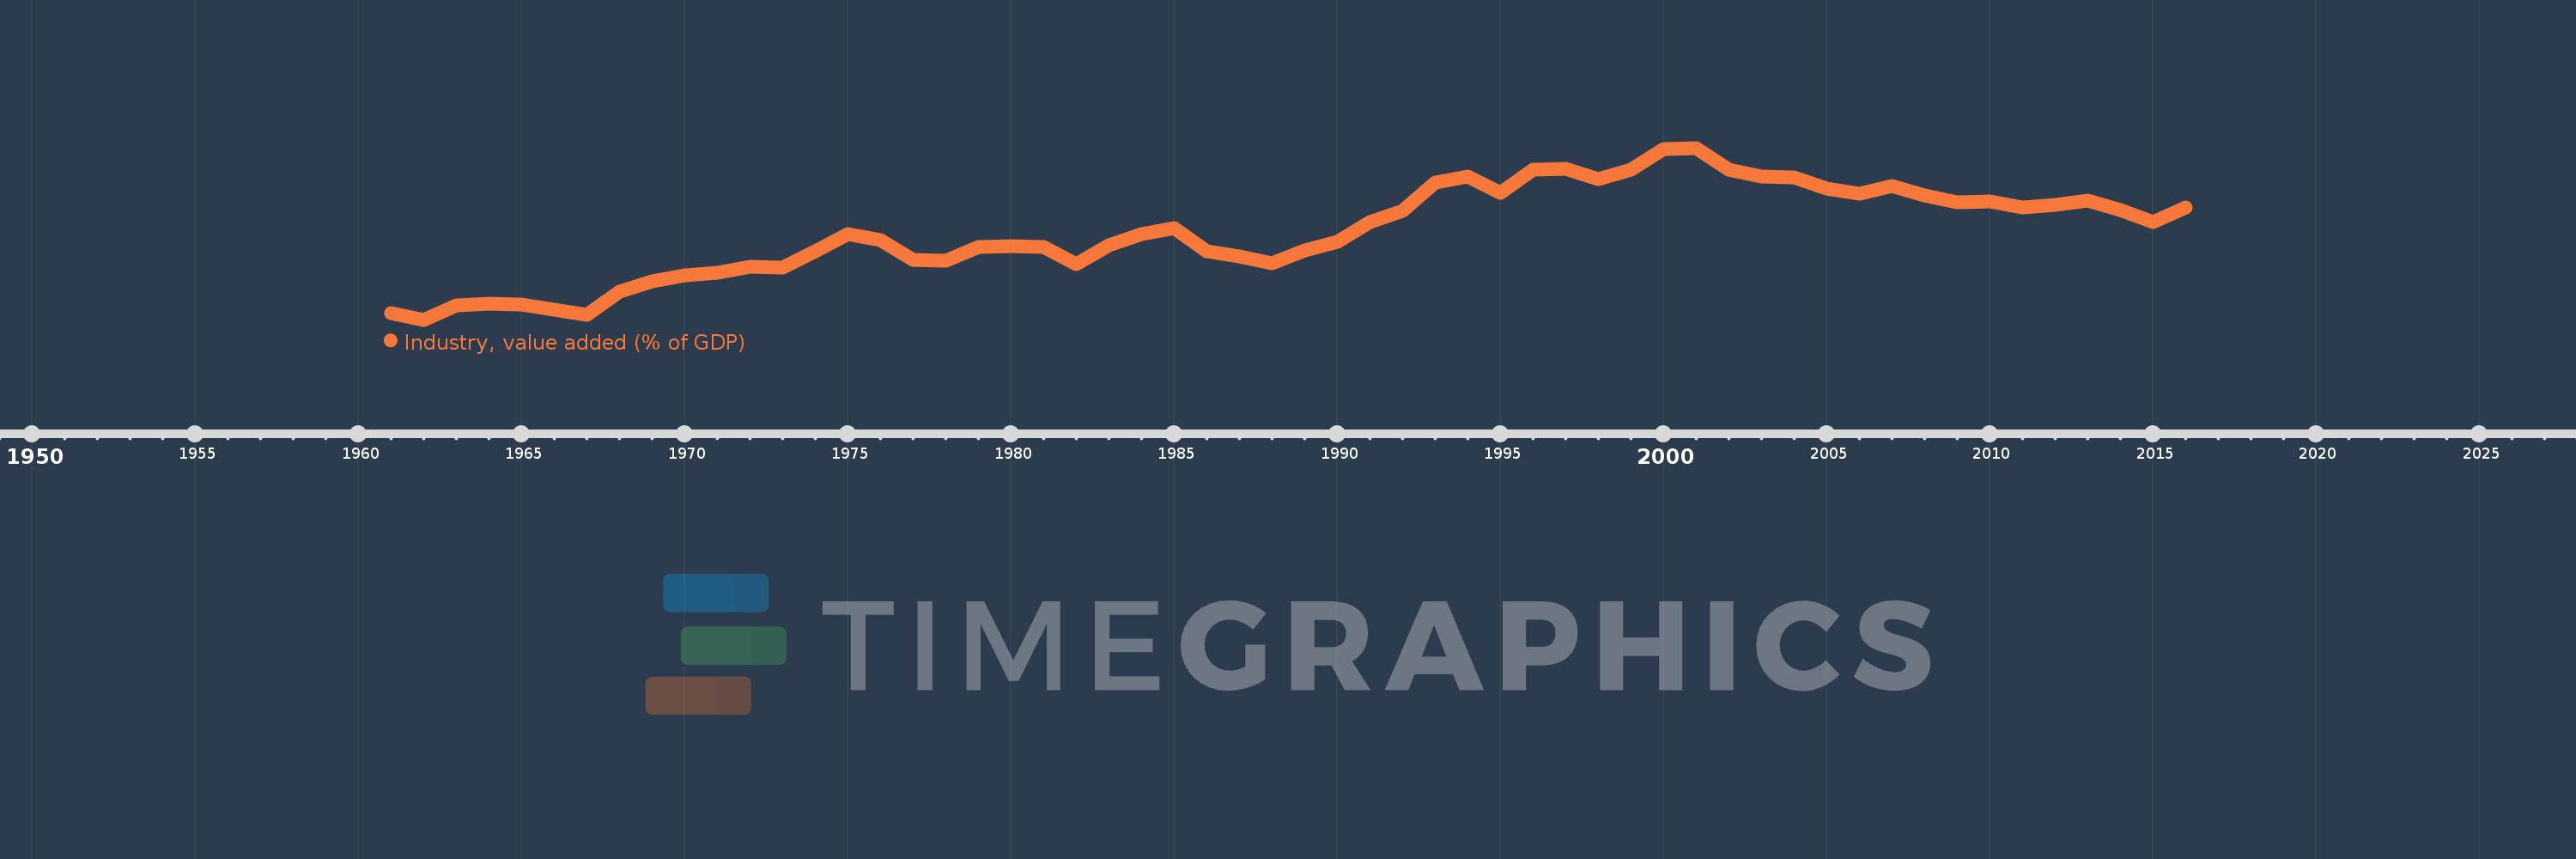
Industry, value added (% of GDP)
2016,2015,2014,2013,2012,2011,2010,2009,2008,2007,2006,2005,2004,2003,2002,2001,2000,1999,1998,1997,1996,1995,1994,1993,1992,1991,1990,1989,1988,1987,1986,1985,1984,1983,1982,1981,1980,1979,1978,1977,1976,1975,1974,1973,1972,1971,1970,1969,1968,1967,1966,1965,1964,1963,1962,1961
This statistics in other country:
AfghanistanAlbaniaAlgeriaAndorraAngolaAntigua and BarbudaArab WorldArgentinaArmeniaArubaAustraliaAustriaAzerbaijanBahamas, TheBahrainBangladeshBarbadosBelarusBelgiumBelizeBeninBermudaBhutanBoliviaBosnia and HerzegovinaBotswanaBrazilBrunei DarussalamBulgariaBurkina FasoBurundiCabo VerdeCambodiaCameroonCanadaCaribbean small statesCayman IslandsCentral African RepublicCentral Europe and the BalticsChadChileChinaColombiaComorosCongo, Dem. Rep.Congo, Rep.Costa RicaCote d'IvoireCroatiaCubaCyprusCzech RepublicDenmarkDjiboutiDominicaDominican RepublicEarly-demographic dividendEast Asia & PacificEast Asia & Pacific (excluding high income)East Asia & Pacific (IDA & IBRD countries)EcuadorEgypt, Arab Rep.El SalvadorEquatorial GuineaEritreaEstoniaEthiopiaEuro areaEurope & Central AsiaEurope & Central Asia (excluding high income)Europe & Central Asia (IDA & IBRD countries)European UnionFijiFinlandFragile and conflict affected situationsFranceGabonGambia, TheGeorgiaGermanyGhanaGreeceGrenadaGuatemalaGuineaGuinea-BissauGuyanaHeavily indebted poor countries (HIPC)High incomeHondurasHong Kong SAR, ChinaHungaryIBRD onlyIcelandIDA & IBRD totalIDA blendIDA onlyIDA totalIndiaIndonesiaIran, Islamic Rep.IrelandItalyJamaicaJapanJordanKazakhstanKenyaKiribatiKorea, Rep.KosovoKuwaitKyrgyz RepublicLao PDRLate-demographic dividendLatin America & Caribbean Latin America & Caribbean (excluding high income)Latin America & the Caribbean (IDA & IBRD countries)LatviaLeast developed countries: UN classificationLebanonLesothoLibyaLiechtensteinLithuaniaLow & middle incomeLow incomeLower middle incomeLuxembourgMacao SAR, ChinaMacedonia, FYRMadagascarMalawiMalaysiaMaldivesMaliMaltaMarshall IslandsMauritaniaMauritiusMexicoMicronesia, Fed. Sts.Middle East & North AfricaMiddle East & North Africa (excluding high income)Middle East & North Africa (IDA & IBRD countries)Middle incomeMoldovaMongoliaMontenegroMoroccoMozambiqueMyanmarNamibiaNepalNetherlandsNew CaledoniaNew ZealandNicaraguaNigerNigeriaNorth AmericaNorwayOECD membersOmanOther small statesPacific island small statesPakistanPalauPanamaPapua New GuineaParaguayPeruPhilippinesPolandPortugalPost-demographic dividendPre-demographic dividendPuerto RicoQatarRomaniaRussian FederationRwandaSao Tome and PrincipeSaudi ArabiaSenegalSerbiaSeychellesSierra LeoneSingaporeSlovak RepublicSloveniaSmall statesSolomon IslandsSomaliaSouth AfricaSouth AsiaSouth Asia (IDA & IBRD)SpainSri LankaSt. Kitts and NevisSt. LuciaSt. Vincent and the GrenadinesSub-Saharan Africa Sub-Saharan Africa (excluding high income)Sub-Saharan Africa (IDA & IBRD countries)SudanSurinameSwazilandSwedenSwitzerlandSyrian Arab RepublicTajikistanTanzaniaThailandTimor-LesteTogoTongaTrinidad and TobagoTunisiaTurkeyTurkmenistanTuvaluUgandaUkraineUnited KingdomUnited StatesUpper middle incomeUruguayUzbekistanVanuatuVenezuela, RBVietnamWest Bank and GazaWorldYemen, Rep.ZambiaZimbabwe Timeline:
This timeline shows a graph from 1961 to 2016 of Honduras. No data until 1960. Number of actual observations by date: 56.
Source name:
World Development Indicators
Source organization:
World Bank national accounts data, and OECD National Accounts data files.
Categories, topics:
Economy & Growth
Last updated:
apr 23, 2017
Indicators value changes by year
Minimum:
18.335
jan 1, 1962
At the date of observation
Value
Absolute change
Change from previous value
jan 1, 1961
18.886
+18.886
0.0%
jan 1, 1962
18.335
-0.551
-2.92%
jan 1, 1963
19.543
+1.208
6.59%
jan 1, 1964
19.659
+0.117
0.6%
jan 1, 1965
19.553
-0.106
-0.54%
jan 1, 1966
19.147
-0.406
-2.08%
jan 1, 1967
18.756
-0.391
-2.04%
jan 1, 1968
20.654
+1.898
10.12%
jan 1, 1969
21.476
+0.822
3.98%
jan 1, 1970
21.997
+0.521
2.43%
jan 1, 1971
22.188
+0.191
0.87%
jan 1, 1972
22.669
+0.48
2.17%
jan 1, 1973
22.612
-0.057
-0.25%
jan 1, 1974
23.988
+1.376
6.09%
jan 1, 1975
25.348
+1.36
5.67%
jan 1, 1976
24.914
-0.434
-1.71%
jan 1, 1977
23.237
-1.677
-6.73%
jan 1, 1978
23.158
-0.078
-0.34%
jan 1, 1979
24.294
+1.135
4.9%
jan 1, 1980
24.382
+0.089
0.37%
jan 1, 1981
24.32
-0.063
-0.26%
jan 1, 1982
22.927
-1.392
-5.72%
jan 1, 1983
24.431
+1.504
6.56%
jan 1, 1984
25.357
+0.925
3.79%
jan 1, 1985
25.842
+0.486
1.92%
jan 1, 1986
23.967
-1.875
-7.26%
jan 1, 1987
23.523
-0.444
-1.85%
jan 1, 1988
22.972
-0.551
-2.34%
jan 1, 1989
24.045
+1.072
4.67%
jan 1, 1990
24.708
+0.664
2.76%
jan 1, 1991
26.362
+1.654
6.69%
jan 1, 1992
27.299
+0.936
3.55%
jan 1, 1993
29.595
+2.296
8.41%
jan 1, 1994
30.115
+0.52
1.76%
jan 1, 1995
28.797
-1.319
-4.38%
jan 1, 1996
30.699
+1.903
6.61%
jan 1, 1997
30.753
+0.054
0.17%
jan 1, 1998
29.873
-0.881
-2.86%
jan 1, 1999
30.672
+0.799
2.68%
jan 1, 2000
32.349
+1.677
5.47%
jan 1, 2001
32.46
+0.112
0.35%
jan 1, 2002
30.688
-1.773
-5.46%
jan 1, 2003
30.101
-0.587
-1.91%
jan 1, 2004
30.07
-0.031
-0.1%
jan 1, 2005
29.135
-0.936
-3.11%
jan 1, 2006
28.726
-0.409
-1.4%
jan 1, 2007
29.33
+0.604
2.1%
jan 1, 2008
28.564
-0.766
-2.61%
jan 1, 2009
28.001
-0.563
-1.97%
jan 1, 2010
28.058
+0.057
0.2%
jan 1, 2011
27.574
-0.484
-1.73%
jan 1, 2012
27.774
+0.2
0.73%
jan 1, 2013
28.117
+0.343
1.23%
jan 1, 2014
27.338
-0.779
-2.77%
jan 1, 2015
26.4
-0.938
-3.43%
jan 1, 2016
27.534
+1.135
4.3%
Ranking of countries by current statistics by years


Comments: