29
/
en
AIzaSyAYiBZKx7MnpbEhh9jyipgxe19OcubqV5w
April 1, 2024
69958
Argentina
ARG
true
2
1
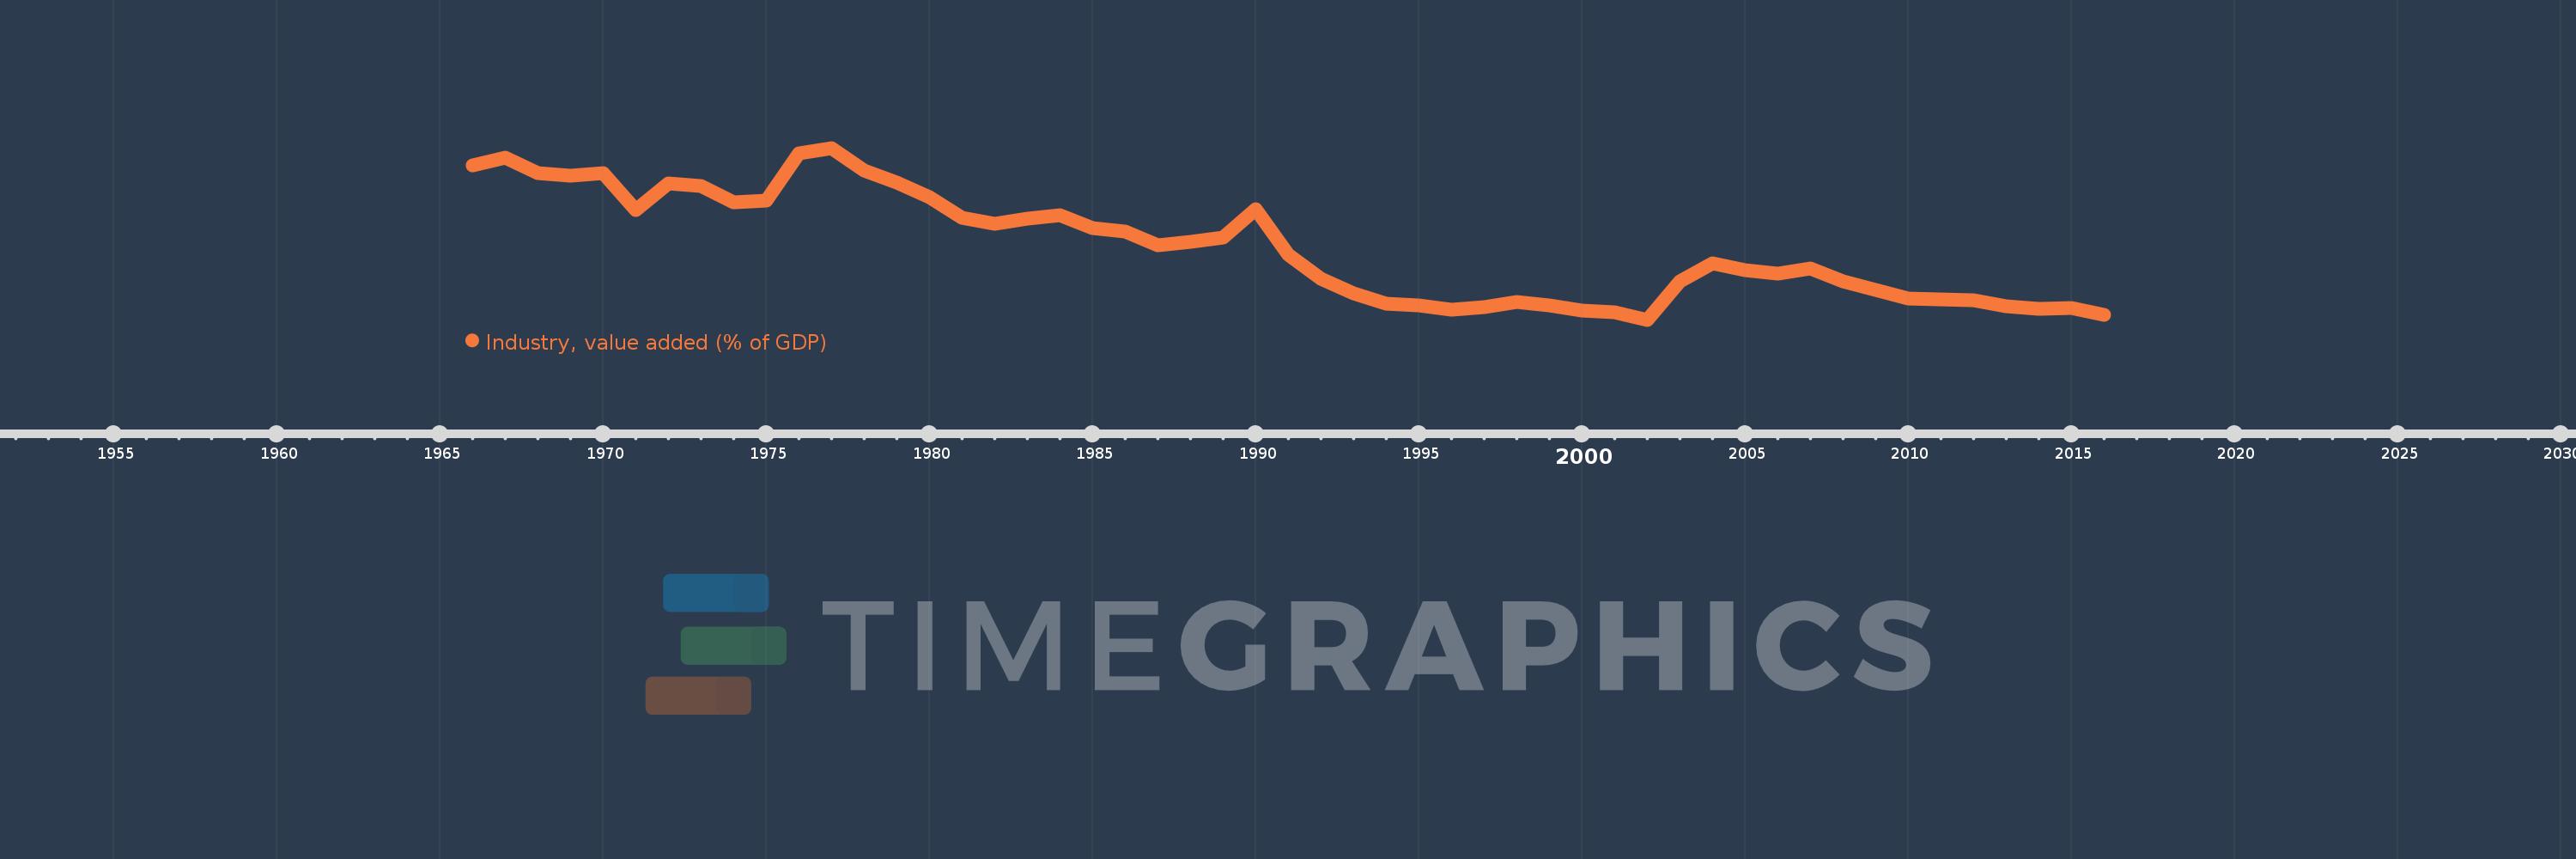
Industry, value added (% of GDP)
2016,2015,2014,2013,2012,2011,2010,2009,2008,2007,2006,2005,2004,2003,2002,2001,2000,1999,1998,1997,1996,1995,1994,1993,1992,1991,1990,1989,1988,1987,1986,1985,1984,1983,1982,1981,1980,1979,1978,1977,1976,1975,1974,1973,1972,1971,1970,1969,1968,1967,1966
This statistics in other country:
AfghanistanAlbaniaAlgeriaAndorraAngolaAntigua and BarbudaArab WorldArgentinaArmeniaArubaAustraliaAustriaAzerbaijanBahamas, TheBahrainBangladeshBarbadosBelarusBelgiumBelizeBeninBermudaBhutanBoliviaBosnia and HerzegovinaBotswanaBrazilBrunei DarussalamBulgariaBurkina FasoBurundiCabo VerdeCambodiaCameroonCanadaCaribbean small statesCayman IslandsCentral African RepublicCentral Europe and the BalticsChadChileChinaColombiaComorosCongo, Dem. Rep.Congo, Rep.Costa RicaCote d'IvoireCroatiaCubaCyprusCzech RepublicDenmarkDjiboutiDominicaDominican RepublicEarly-demographic dividendEast Asia & PacificEast Asia & Pacific (excluding high income)East Asia & Pacific (IDA & IBRD countries)EcuadorEgypt, Arab Rep.El SalvadorEquatorial GuineaEritreaEstoniaEthiopiaEuro areaEurope & Central AsiaEurope & Central Asia (excluding high income)Europe & Central Asia (IDA & IBRD countries)European UnionFijiFinlandFragile and conflict affected situationsFranceGabonGambia, TheGeorgiaGermanyGhanaGreeceGrenadaGuatemalaGuineaGuinea-BissauGuyanaHeavily indebted poor countries (HIPC)High incomeHondurasHong Kong SAR, ChinaHungaryIBRD onlyIcelandIDA & IBRD totalIDA blendIDA onlyIDA totalIndiaIndonesiaIran, Islamic Rep.IrelandItalyJamaicaJapanJordanKazakhstanKenyaKiribatiKorea, Rep.KosovoKuwaitKyrgyz RepublicLao PDRLate-demographic dividendLatin America & Caribbean Latin America & Caribbean (excluding high income)Latin America & the Caribbean (IDA & IBRD countries)LatviaLeast developed countries: UN classificationLebanonLesothoLibyaLiechtensteinLithuaniaLow & middle incomeLow incomeLower middle incomeLuxembourgMacao SAR, ChinaMacedonia, FYRMadagascarMalawiMalaysiaMaldivesMaliMaltaMarshall IslandsMauritaniaMauritiusMexicoMicronesia, Fed. Sts.Middle East & North AfricaMiddle East & North Africa (excluding high income)Middle East & North Africa (IDA & IBRD countries)Middle incomeMoldovaMongoliaMontenegroMoroccoMozambiqueMyanmarNamibiaNepalNetherlandsNew CaledoniaNew ZealandNicaraguaNigerNigeriaNorth AmericaNorwayOECD membersOmanOther small statesPacific island small statesPakistanPalauPanamaPapua New GuineaParaguayPeruPhilippinesPolandPortugalPost-demographic dividendPre-demographic dividendPuerto RicoQatarRomaniaRussian FederationRwandaSao Tome and PrincipeSaudi ArabiaSenegalSerbiaSeychellesSierra LeoneSingaporeSlovak RepublicSloveniaSmall statesSolomon IslandsSomaliaSouth AfricaSouth AsiaSouth Asia (IDA & IBRD)SpainSri LankaSt. Kitts and NevisSt. LuciaSt. Vincent and the GrenadinesSub-Saharan Africa Sub-Saharan Africa (excluding high income)Sub-Saharan Africa (IDA & IBRD countries)SudanSurinameSwazilandSwedenSwitzerlandSyrian Arab RepublicTajikistanTanzaniaThailandTimor-LesteTogoTongaTrinidad and TobagoTunisiaTurkeyTurkmenistanTuvaluUgandaUkraineUnited KingdomUnited StatesUpper middle incomeUruguayUzbekistanVanuatuVenezuela, RBVietnamWest Bank and GazaWorldYemen, Rep.ZambiaZimbabwe Timeline:
This timeline shows a graph from 1966 to 2016 of Argentina. No data until 1965. Number of actual observations by date: 51.
Source name:
World Development Indicators
Source organization:
World Bank national accounts data, and OECD National Accounts data files.
Categories, topics:
Economy & Growth
Last updated:
apr 23, 2017
Indicators value changes by year
Minimum:
27.035
jan 1, 2002
Maximum:
50.894
jan 1, 1977
At the date of observation
Value
Absolute change
Change from previous value
jan 1, 1966
48.414
+48.414
0.0%
jan 1, 1967
49.605
+1.191
2.46%
jan 1, 1968
47.383
-2.222
-4.48%
jan 1, 1969
47.036
-0.347
-0.73%
jan 1, 1970
47.387
+0.35
0.75%
jan 1, 1971
42.279
-5.108
-10.78%
jan 1, 1972
45.955
+3.676
8.7%
jan 1, 1973
45.582
-0.373
-0.81%
jan 1, 1974
43.352
-2.229
-4.89%
jan 1, 1975
43.593
+0.24
0.55%
jan 1, 1976
50.141
+6.549
15.02%
jan 1, 1977
50.894
+0.752
1.5%
jan 1, 1978
47.806
-3.088
-6.07%
jan 1, 1979
46.098
-1.708
-3.57%
jan 1, 1980
44.028
-2.07
-4.49%
jan 1, 1981
41.22
-2.808
-6.38%
jan 1, 1982
40.338
-0.881
-2.14%
jan 1, 1983
41.103
+0.765
1.9%
jan 1, 1984
41.556
+0.453
1.1%
jan 1, 1985
39.708
-1.848
-4.45%
jan 1, 1986
39.276
-0.432
-1.09%
jan 1, 1987
37.38
-1.896
-4.83%
jan 1, 1988
37.829
+0.448
1.2%
jan 1, 1989
38.487
+0.658
1.74%
jan 1, 1990
42.348
+3.861
10.03%
jan 1, 1991
36.022
-6.326
-14.94%
jan 1, 1992
32.723
-3.299
-9.16%
jan 1, 1993
30.684
-2.039
-6.23%
jan 1, 1994
29.229
-1.455
-4.74%
jan 1, 1995
29.025
-0.205
-0.7%
jan 1, 1996
28.442
-0.583
-2.01%
jan 1, 1997
28.822
+0.38
1.34%
jan 1, 1998
29.529
+0.707
2.45%
jan 1, 1999
29.001
-0.527
-1.79%
jan 1, 2000
28.294
-0.707
-2.44%
jan 1, 2001
28.063
-0.231
-0.82%
jan 1, 2002
27.035
-1.028
-3.66%
jan 1, 2003
32.4
+5.365
19.84%
jan 1, 2004
34.902
+2.502
7.72%
jan 1, 2005
33.874
-1.028
-2.95%
jan 1, 2006
33.49
-0.384
-1.13%
jan 1, 2007
34.211
+0.721
2.15%
jan 1, 2008
32.311
-1.899
-5.55%
jan 1, 2009
31.16
-1.151
-3.56%
jan 1, 2010
29.973
-1.187
-3.81%
jan 1, 2011
29.899
-0.074
-0.25%
jan 1, 2012
29.782
-0.117
-0.39%
jan 1, 2013
28.929
-0.853
-2.86%
jan 1, 2014
28.507
-0.422
-1.46%
jan 1, 2015
28.689
+0.181
0.64%
jan 1, 2016
27.77
-0.919
-3.2%
Ranking of countries by current statistics by years


Comments: