29
/
en
AIzaSyAYiBZKx7MnpbEhh9jyipgxe19OcubqV5w
April 1, 2024
186659
Malawi
MWI
true
2
1
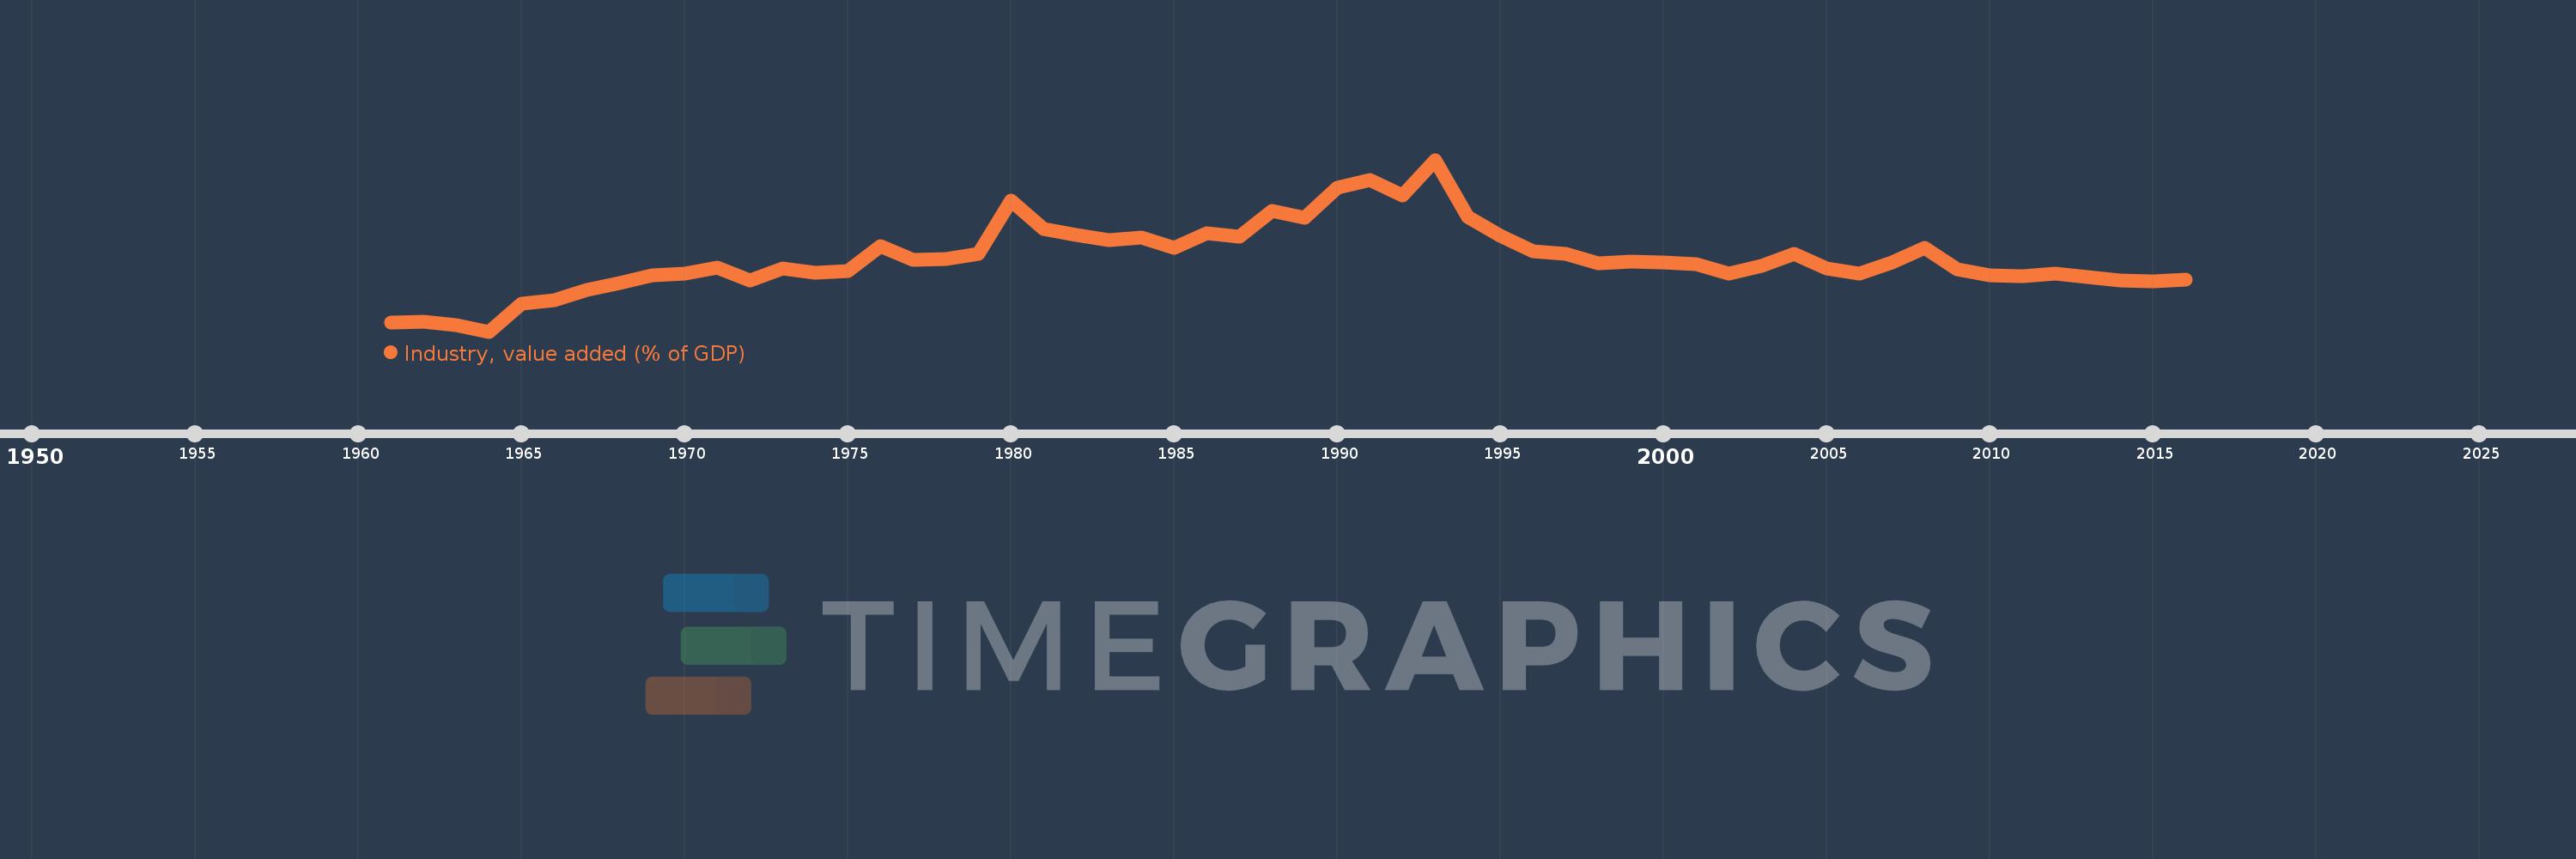
Industry, value added (% of GDP)
2016,2015,2014,2013,2012,2011,2010,2009,2008,2007,2006,2005,2004,2003,2002,2001,2000,1999,1998,1997,1996,1995,1994,1993,1992,1991,1990,1989,1988,1987,1986,1985,1984,1983,1982,1981,1980,1979,1978,1977,1976,1975,1974,1973,1972,1971,1970,1969,1968,1967,1966,1965,1964,1963,1962,1961
This statistics in other country:
AfghanistanAlbaniaAlgeriaAndorraAngolaAntigua and BarbudaArab WorldArgentinaArmeniaArubaAustraliaAustriaAzerbaijanBahamas, TheBahrainBangladeshBarbadosBelarusBelgiumBelizeBeninBermudaBhutanBoliviaBosnia and HerzegovinaBotswanaBrazilBrunei DarussalamBulgariaBurkina FasoBurundiCabo VerdeCambodiaCameroonCanadaCaribbean small statesCayman IslandsCentral African RepublicCentral Europe and the BalticsChadChileChinaColombiaComorosCongo, Dem. Rep.Congo, Rep.Costa RicaCote d'IvoireCroatiaCubaCyprusCzech RepublicDenmarkDjiboutiDominicaDominican RepublicEarly-demographic dividendEast Asia & PacificEast Asia & Pacific (excluding high income)East Asia & Pacific (IDA & IBRD countries)EcuadorEgypt, Arab Rep.El SalvadorEquatorial GuineaEritreaEstoniaEthiopiaEuro areaEurope & Central AsiaEurope & Central Asia (excluding high income)Europe & Central Asia (IDA & IBRD countries)European UnionFijiFinlandFragile and conflict affected situationsFranceGabonGambia, TheGeorgiaGermanyGhanaGreeceGrenadaGuatemalaGuineaGuinea-BissauGuyanaHeavily indebted poor countries (HIPC)High incomeHondurasHong Kong SAR, ChinaHungaryIBRD onlyIcelandIDA & IBRD totalIDA blendIDA onlyIDA totalIndiaIndonesiaIran, Islamic Rep.IrelandItalyJamaicaJapanJordanKazakhstanKenyaKiribatiKorea, Rep.KosovoKuwaitKyrgyz RepublicLao PDRLate-demographic dividendLatin America & Caribbean Latin America & Caribbean (excluding high income)Latin America & the Caribbean (IDA & IBRD countries)LatviaLeast developed countries: UN classificationLebanonLesothoLibyaLiechtensteinLithuaniaLow & middle incomeLow incomeLower middle incomeLuxembourgMacao SAR, ChinaMacedonia, FYRMadagascarMalawiMalaysiaMaldivesMaliMaltaMarshall IslandsMauritaniaMauritiusMexicoMicronesia, Fed. Sts.Middle East & North AfricaMiddle East & North Africa (excluding high income)Middle East & North Africa (IDA & IBRD countries)Middle incomeMoldovaMongoliaMontenegroMoroccoMozambiqueMyanmarNamibiaNepalNetherlandsNew CaledoniaNew ZealandNicaraguaNigerNigeriaNorth AmericaNorwayOECD membersOmanOther small statesPacific island small statesPakistanPalauPanamaPapua New GuineaParaguayPeruPhilippinesPolandPortugalPost-demographic dividendPre-demographic dividendPuerto RicoQatarRomaniaRussian FederationRwandaSao Tome and PrincipeSaudi ArabiaSenegalSerbiaSeychellesSierra LeoneSingaporeSlovak RepublicSloveniaSmall statesSolomon IslandsSomaliaSouth AfricaSouth AsiaSouth Asia (IDA & IBRD)SpainSri LankaSt. Kitts and NevisSt. LuciaSt. Vincent and the GrenadinesSub-Saharan Africa Sub-Saharan Africa (excluding high income)Sub-Saharan Africa (IDA & IBRD countries)SudanSurinameSwazilandSwedenSwitzerlandSyrian Arab RepublicTajikistanTanzaniaThailandTimor-LesteTogoTongaTrinidad and TobagoTunisiaTurkeyTurkmenistanTuvaluUgandaUkraineUnited KingdomUnited StatesUpper middle incomeUruguayUzbekistanVanuatuVenezuela, RBVietnamWest Bank and GazaWorldYemen, Rep.ZambiaZimbabwe Timeline:
This timeline shows a graph from 1961 to 2016 of Malawi. No data until 1960. Number of actual observations by date: 56.
Source name:
World Development Indicators
Source organization:
World Bank national accounts data, and OECD National Accounts data files.
Categories, topics:
Economy & Growth
Last updated:
apr 23, 2017
Indicators value changes by year
Maximum:
31.526
jan 1, 1993
At the date of observation
Value
Absolute change
Change from previous value
jan 1, 1961
10.311
+10.311
0.0%
jan 1, 1962
10.456
+0.145
1.41%
jan 1, 1963
10.047
-0.409
-3.91%
jan 1, 1964
9.188
-0.86
-8.56%
jan 1, 1965
12.798
+3.61
39.29%
jan 1, 1966
13.278
+0.481
3.76%
jan 1, 1967
14.571
+1.292
9.73%
jan 1, 1968
15.551
+0.98
6.73%
jan 1, 1969
16.555
+1.004
6.46%
jan 1, 1970
16.675
+0.12
0.72%
jan 1, 1971
17.465
+0.79
4.74%
jan 1, 1972
15.804
-1.66
-9.51%
jan 1, 1973
17.441
+1.637
10.36%
jan 1, 1974
16.813
-0.628
-3.6%
jan 1, 1975
17.055
+0.242
1.44%
jan 1, 1976
20.336
+3.28
19.23%
jan 1, 1977
18.52
-1.816
-8.93%
jan 1, 1978
18.658
+0.138
0.74%
jan 1, 1979
19.3
+0.642
3.44%
jan 1, 1980
26.213
+6.914
35.82%
jan 1, 1981
22.544
-3.67
-14.0%
jan 1, 1982
21.706
-0.838
-3.72%
jan 1, 1983
21.06
-0.646
-2.98%
jan 1, 1984
21.448
+0.387
1.84%
jan 1, 1985
20.068
-1.38
-6.43%
jan 1, 1986
21.923
+1.855
9.24%
jan 1, 1987
21.511
-0.411
-1.88%
jan 1, 1988
24.897
+3.385
15.74%
jan 1, 1989
23.973
-0.924
-3.71%
jan 1, 1990
27.91
+3.938
16.43%
jan 1, 1991
28.89
+0.98
3.51%
jan 1, 1992
26.907
-1.983
-6.86%
jan 1, 1993
31.526
+4.619
17.17%
jan 1, 1994
24.111
-7.415
-23.52%
jan 1, 1995
21.69
-2.42
-10.04%
jan 1, 1996
19.648
-2.042
-9.41%
jan 1, 1997
19.338
-0.31
-1.58%
jan 1, 1998
18.083
-1.255
-6.49%
jan 1, 1999
18.282
+0.199
1.1%
jan 1, 2000
18.234
-0.048
-0.26%
jan 1, 2001
17.916
-0.317
-1.74%
jan 1, 2002
16.688
-1.229
-6.86%
jan 1, 2003
17.706
+1.019
6.1%
jan 1, 2004
19.308
+1.601
9.04%
jan 1, 2005
17.435
-1.872
-9.7%
jan 1, 2006
16.76
-0.675
-3.87%
jan 1, 2007
18.172
+1.411
8.42%
jan 1, 2008
20.071
+1.9
10.46%
jan 1, 2009
17.334
-2.738
-13.64%
jan 1, 2010
16.532
-0.802
-4.63%
jan 1, 2011
16.401
-0.131
-0.79%
jan 1, 2012
16.74
+0.339
2.07%
jan 1, 2013
16.25
-0.49
-2.93%
jan 1, 2014
15.864
-0.386
-2.38%
jan 1, 2015
15.727
-0.137
-0.86%
jan 1, 2016
15.89
+0.164
1.04%
Ranking of countries by current statistics by years


Comments: