29
/
en
AIzaSyAYiBZKx7MnpbEhh9jyipgxe19OcubqV5w
April 1, 2024
55618
Pre-demographic dividend
PRE
false
2
1
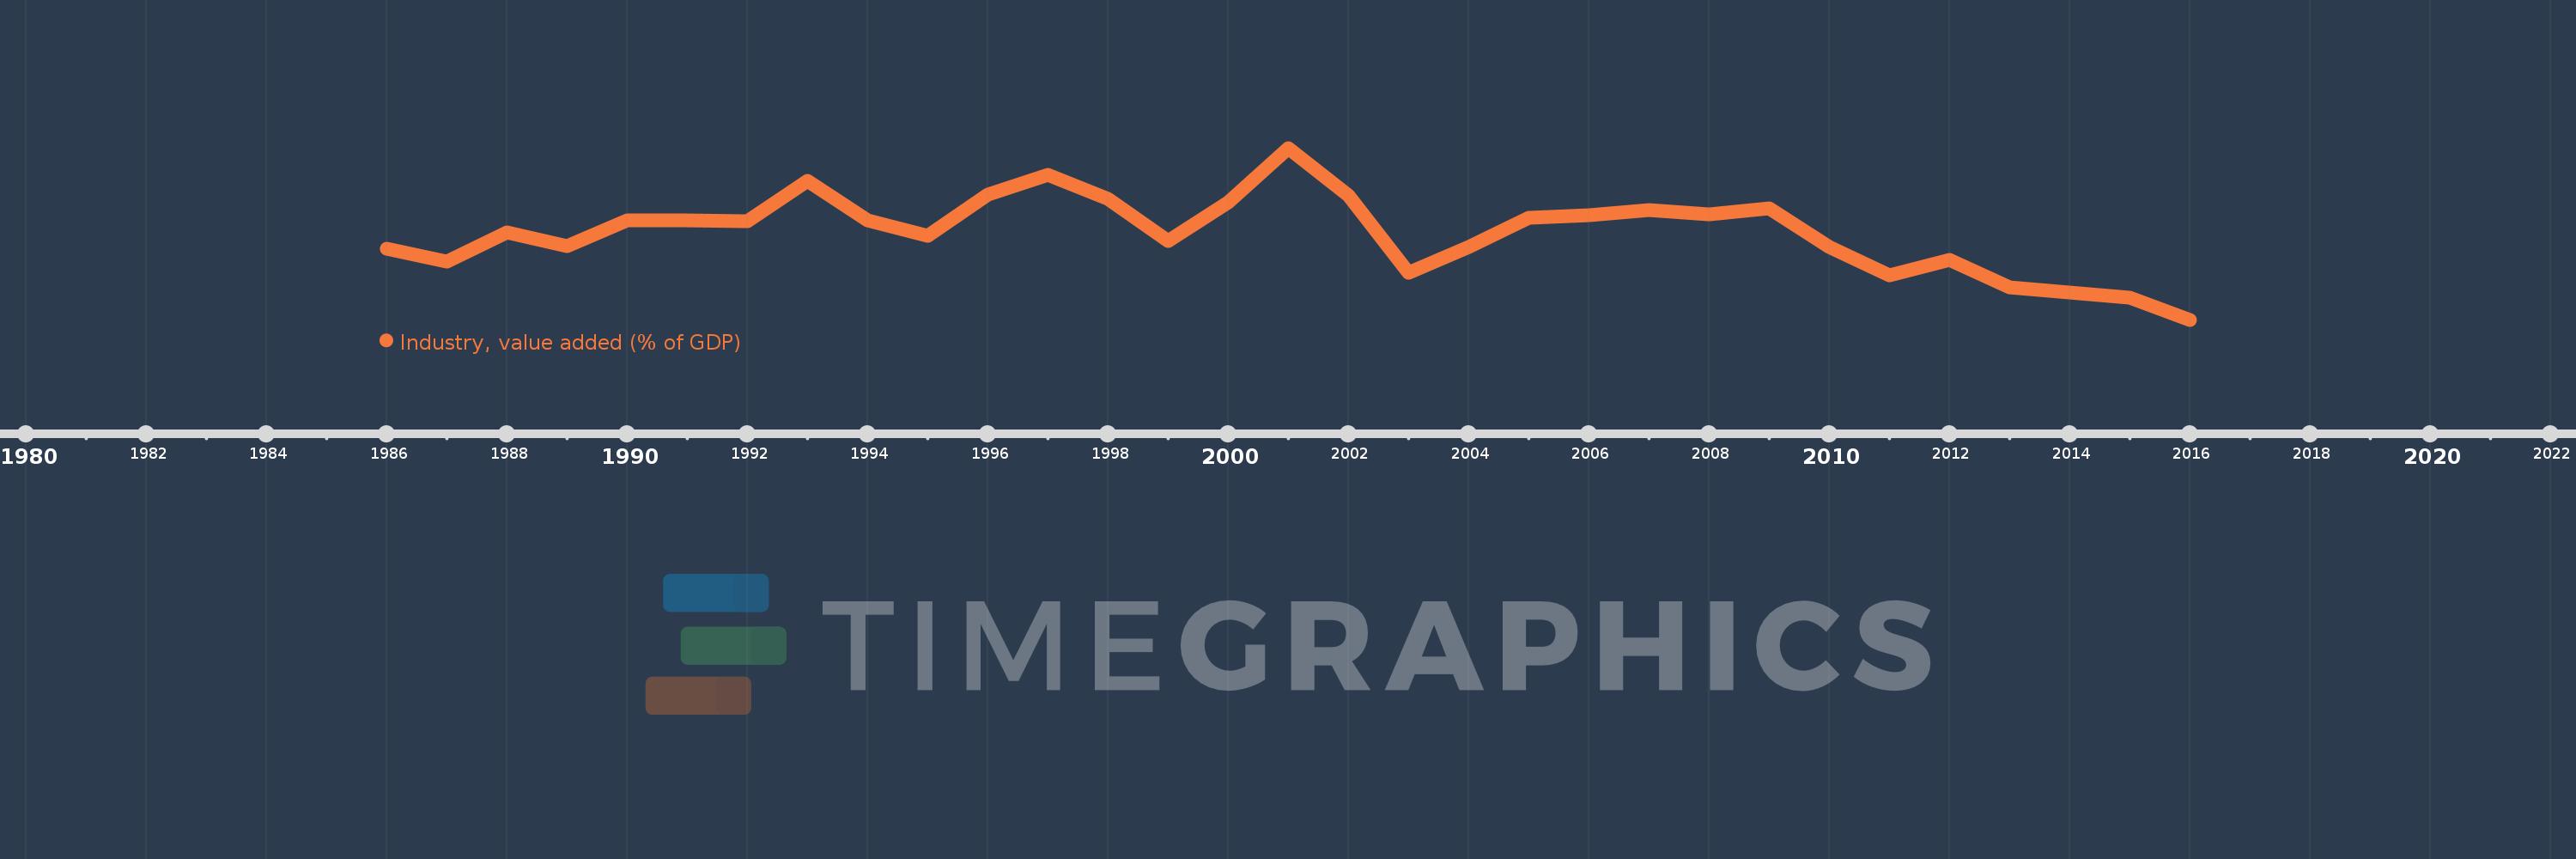
Industry, value added (% of GDP)
2016,2015,2014,2013,2012,2011,2010,2009,2008,2007,2006,2005,2004,2003,2002,2001,2000,1999,1998,1997,1996,1995,1994,1993,1992,1991,1990,1989,1988,1987,1986
This statistics in other country:
AfghanistanAlbaniaAlgeriaAndorraAngolaAntigua and BarbudaArab WorldArgentinaArmeniaArubaAustraliaAustriaAzerbaijanBahamas, TheBahrainBangladeshBarbadosBelarusBelgiumBelizeBeninBermudaBhutanBoliviaBosnia and HerzegovinaBotswanaBrazilBrunei DarussalamBulgariaBurkina FasoBurundiCabo VerdeCambodiaCameroonCanadaCaribbean small statesCayman IslandsCentral African RepublicCentral Europe and the BalticsChadChileChinaColombiaComorosCongo, Dem. Rep.Congo, Rep.Costa RicaCote d'IvoireCroatiaCubaCyprusCzech RepublicDenmarkDjiboutiDominicaDominican RepublicEarly-demographic dividendEast Asia & PacificEast Asia & Pacific (excluding high income)East Asia & Pacific (IDA & IBRD countries)EcuadorEgypt, Arab Rep.El SalvadorEquatorial GuineaEritreaEstoniaEthiopiaEuro areaEurope & Central AsiaEurope & Central Asia (excluding high income)Europe & Central Asia (IDA & IBRD countries)European UnionFijiFinlandFragile and conflict affected situationsFranceGabonGambia, TheGeorgiaGermanyGhanaGreeceGrenadaGuatemalaGuineaGuinea-BissauGuyanaHeavily indebted poor countries (HIPC)High incomeHondurasHong Kong SAR, ChinaHungaryIBRD onlyIcelandIDA & IBRD totalIDA blendIDA onlyIDA totalIndiaIndonesiaIran, Islamic Rep.IrelandItalyJamaicaJapanJordanKazakhstanKenyaKiribatiKorea, Rep.KosovoKuwaitKyrgyz RepublicLao PDRLate-demographic dividendLatin America & Caribbean Latin America & Caribbean (excluding high income)Latin America & the Caribbean (IDA & IBRD countries)LatviaLeast developed countries: UN classificationLebanonLesothoLibyaLiechtensteinLithuaniaLow & middle incomeLow incomeLower middle incomeLuxembourgMacao SAR, ChinaMacedonia, FYRMadagascarMalawiMalaysiaMaldivesMaliMaltaMarshall IslandsMauritaniaMauritiusMexicoMicronesia, Fed. Sts.Middle East & North AfricaMiddle East & North Africa (excluding high income)Middle East & North Africa (IDA & IBRD countries)Middle incomeMoldovaMongoliaMontenegroMoroccoMozambiqueMyanmarNamibiaNepalNetherlandsNew CaledoniaNew ZealandNicaraguaNigerNigeriaNorth AmericaNorwayOECD membersOmanOther small statesPacific island small statesPakistanPalauPanamaPapua New GuineaParaguayPeruPhilippinesPolandPortugalPost-demographic dividendPre-demographic dividendPuerto RicoQatarRomaniaRussian FederationRwandaSao Tome and PrincipeSaudi ArabiaSenegalSerbiaSeychellesSierra LeoneSingaporeSlovak RepublicSloveniaSmall statesSolomon IslandsSomaliaSouth AfricaSouth AsiaSouth Asia (IDA & IBRD)SpainSri LankaSt. Kitts and NevisSt. LuciaSt. Vincent and the GrenadinesSub-Saharan Africa Sub-Saharan Africa (excluding high income)Sub-Saharan Africa (IDA & IBRD countries)SudanSurinameSwazilandSwedenSwitzerlandSyrian Arab RepublicTajikistanTanzaniaThailandTimor-LesteTogoTongaTrinidad and TobagoTunisiaTurkeyTurkmenistanTuvaluUgandaUkraineUnited KingdomUnited StatesUpper middle incomeUruguayUzbekistanVanuatuVenezuela, RBVietnamWest Bank and GazaWorldYemen, Rep.ZambiaZimbabwe Timeline:
This timeline shows a graph from 1986 to 2016 of Pre-demographic dividend. No data until 1985. Number of actual observations by date: 31.
Source name:
World Development Indicators
Source organization:
World Bank national accounts data, and OECD National Accounts data files.
Categories, topics:
Economy & Growth
Last updated:
apr 23, 2017
Indicators value changes by year
Maximum:
39.515
jan 1, 2001
At the date of observation
Value
Absolute change
Change from previous value
jan 1, 1986
28.82
+28.82
0.0%
jan 1, 1987
27.425
-1.395
-4.84%
jan 1, 1988
30.524
+3.099
11.3%
jan 1, 1989
29.071
-1.453
-4.76%
jan 1, 1990
31.784
+2.713
9.33%
jan 1, 1991
31.785
+0.002
0.01%
jan 1, 1992
31.737
-0.049
-0.15%
jan 1, 1993
36.032
+4.295
13.53%
jan 1, 1994
31.765
-4.267
-11.84%
jan 1, 1995
30.165
-1.599
-5.04%
jan 1, 1996
34.526
+4.36
14.45%
jan 1, 1997
36.655
+2.129
6.17%
jan 1, 1998
34.113
-2.542
-6.93%
jan 1, 1999
29.659
-4.454
-13.06%
jan 1, 2000
33.712
+4.053
13.67%
jan 1, 2001
39.515
+5.802
17.21%
jan 1, 2002
34.467
-5.047
-12.77%
jan 1, 2003
26.22
-8.247
-23.93%
jan 1, 2004
28.971
+2.751
10.49%
jan 1, 2005
32.115
+3.143
10.85%
jan 1, 2006
32.387
+0.273
0.85%
jan 1, 2007
32.862
+0.475
1.47%
jan 1, 2008
32.462
-0.4
-1.22%
jan 1, 2009
33.064
+0.602
1.86%
jan 1, 2010
28.97
-4.095
-12.38%
jan 1, 2011
25.946
-3.024
-10.44%
jan 1, 2012
27.577
+1.631
6.29%
jan 1, 2013
24.716
-2.861
-10.37%
jan 1, 2014
24.114
-0.602
-2.44%
jan 1, 2015
23.612
-0.502
-2.08%
jan 1, 2016
21.23
-2.381
-10.09%
Ranking of countries by current statistics by years


Comments: