29
/
en
AIzaSyAYiBZKx7MnpbEhh9jyipgxe19OcubqV5w
April 1, 2024
187935
Malaysia
MYS
true
2
1
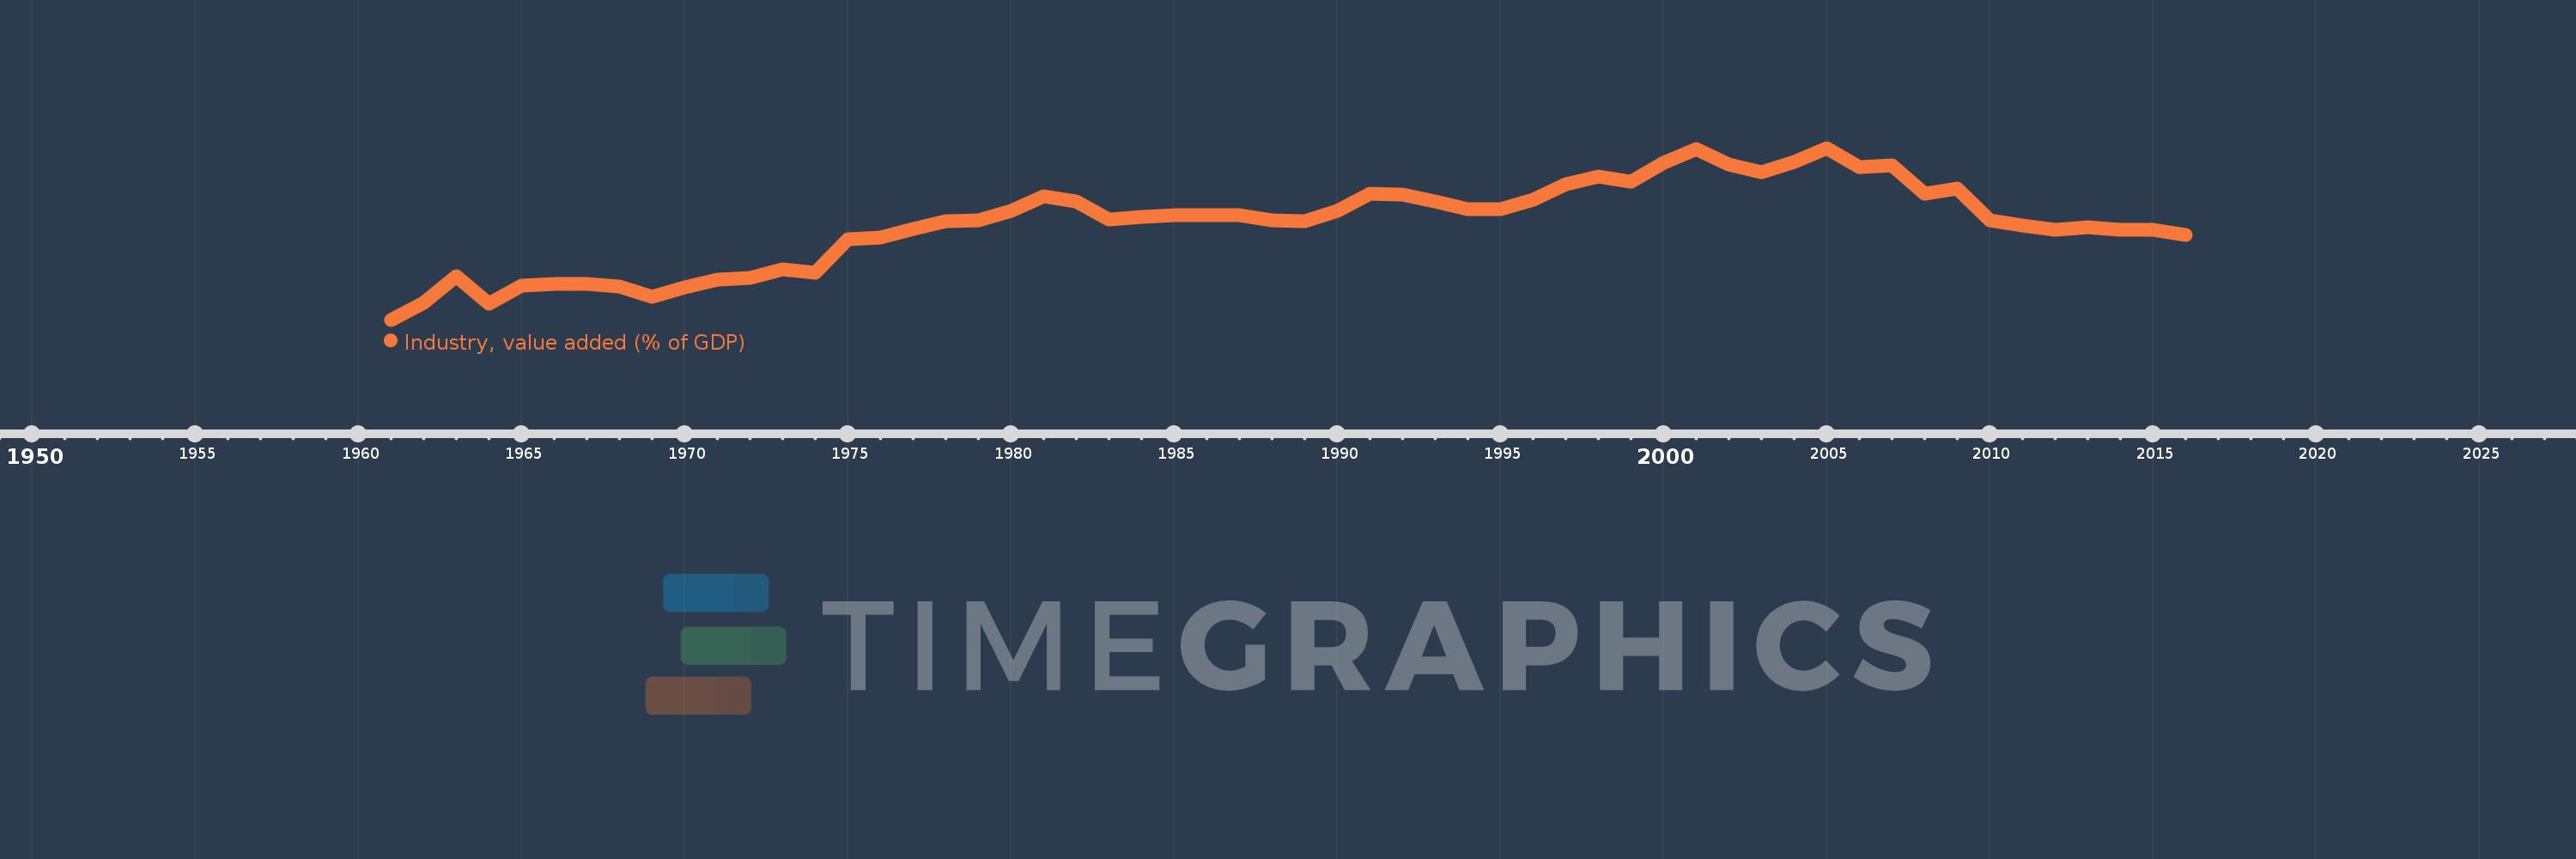
Industry, value added (% of GDP)
2016,2015,2014,2013,2012,2011,2010,2009,2008,2007,2006,2005,2004,2003,2002,2001,2000,1999,1998,1997,1996,1995,1994,1993,1992,1991,1990,1989,1988,1987,1986,1985,1984,1983,1982,1981,1980,1979,1978,1977,1976,1975,1974,1973,1972,1971,1970,1969,1968,1967,1966,1965,1964,1963,1962,1961
This statistics in other country:
AfghanistanAlbaniaAlgeriaAndorraAngolaAntigua and BarbudaArab WorldArgentinaArmeniaArubaAustraliaAustriaAzerbaijanBahamas, TheBahrainBangladeshBarbadosBelarusBelgiumBelizeBeninBermudaBhutanBoliviaBosnia and HerzegovinaBotswanaBrazilBrunei DarussalamBulgariaBurkina FasoBurundiCabo VerdeCambodiaCameroonCanadaCaribbean small statesCayman IslandsCentral African RepublicCentral Europe and the BalticsChadChileChinaColombiaComorosCongo, Dem. Rep.Congo, Rep.Costa RicaCote d'IvoireCroatiaCubaCyprusCzech RepublicDenmarkDjiboutiDominicaDominican RepublicEarly-demographic dividendEast Asia & PacificEast Asia & Pacific (excluding high income)East Asia & Pacific (IDA & IBRD countries)EcuadorEgypt, Arab Rep.El SalvadorEquatorial GuineaEritreaEstoniaEthiopiaEuro areaEurope & Central AsiaEurope & Central Asia (excluding high income)Europe & Central Asia (IDA & IBRD countries)European UnionFijiFinlandFragile and conflict affected situationsFranceGabonGambia, TheGeorgiaGermanyGhanaGreeceGrenadaGuatemalaGuineaGuinea-BissauGuyanaHeavily indebted poor countries (HIPC)High incomeHondurasHong Kong SAR, ChinaHungaryIBRD onlyIcelandIDA & IBRD totalIDA blendIDA onlyIDA totalIndiaIndonesiaIran, Islamic Rep.IrelandItalyJamaicaJapanJordanKazakhstanKenyaKiribatiKorea, Rep.KosovoKuwaitKyrgyz RepublicLao PDRLate-demographic dividendLatin America & Caribbean Latin America & Caribbean (excluding high income)Latin America & the Caribbean (IDA & IBRD countries)LatviaLeast developed countries: UN classificationLebanonLesothoLibyaLiechtensteinLithuaniaLow & middle incomeLow incomeLower middle incomeLuxembourgMacao SAR, ChinaMacedonia, FYRMadagascarMalawiMalaysiaMaldivesMaliMaltaMarshall IslandsMauritaniaMauritiusMexicoMicronesia, Fed. Sts.Middle East & North AfricaMiddle East & North Africa (excluding high income)Middle East & North Africa (IDA & IBRD countries)Middle incomeMoldovaMongoliaMontenegroMoroccoMozambiqueMyanmarNamibiaNepalNetherlandsNew CaledoniaNew ZealandNicaraguaNigerNigeriaNorth AmericaNorwayOECD membersOmanOther small statesPacific island small statesPakistanPalauPanamaPapua New GuineaParaguayPeruPhilippinesPolandPortugalPost-demographic dividendPre-demographic dividendPuerto RicoQatarRomaniaRussian FederationRwandaSao Tome and PrincipeSaudi ArabiaSenegalSerbiaSeychellesSierra LeoneSingaporeSlovak RepublicSloveniaSmall statesSolomon IslandsSomaliaSouth AfricaSouth AsiaSouth Asia (IDA & IBRD)SpainSri LankaSt. Kitts and NevisSt. LuciaSt. Vincent and the GrenadinesSub-Saharan Africa Sub-Saharan Africa (excluding high income)Sub-Saharan Africa (IDA & IBRD countries)SudanSurinameSwazilandSwedenSwitzerlandSyrian Arab RepublicTajikistanTanzaniaThailandTimor-LesteTogoTongaTrinidad and TobagoTunisiaTurkeyTurkmenistanTuvaluUgandaUkraineUnited KingdomUnited StatesUpper middle incomeUruguayUzbekistanVanuatuVenezuela, RBVietnamWest Bank and GazaWorldYemen, Rep.ZambiaZimbabwe Timeline:
This timeline shows a graph from 1961 to 2016 of Malaysia. No data until 1960. Number of actual observations by date: 56.
Source name:
World Development Indicators
Source organization:
World Bank national accounts data, and OECD National Accounts data files.
Categories, topics:
Economy & Growth
Last updated:
apr 23, 2017
Indicators value changes by year
Minimum:
24.712
jan 1, 1961
At the date of observation
Value
Absolute change
Change from previous value
jan 1, 1961
24.712
+24.712
0.0%
jan 1, 1962
27.1
+2.388
9.66%
jan 1, 1963
30.782
+3.682
13.59%
jan 1, 1964
26.989
-3.793
-12.32%
jan 1, 1965
29.42
+2.431
9.01%
jan 1, 1966
29.63
+0.21
0.71%
jan 1, 1967
29.645
+0.015
0.05%
jan 1, 1968
29.314
-0.332
-1.12%
jan 1, 1969
27.906
-1.408
-4.8%
jan 1, 1970
29.202
+1.296
4.65%
jan 1, 1971
30.319
+1.116
3.82%
jan 1, 1972
30.455
+0.137
0.45%
jan 1, 1973
31.677
+1.222
4.01%
jan 1, 1974
31.252
-0.425
-1.34%
jan 1, 1975
35.856
+4.603
14.73%
jan 1, 1976
36.131
+0.276
0.77%
jan 1, 1977
37.282
+1.151
3.19%
jan 1, 1978
38.387
+1.104
2.96%
jan 1, 1979
38.504
+0.117
0.3%
jan 1, 1980
39.831
+1.327
3.45%
jan 1, 1981
41.792
+1.961
4.92%
jan 1, 1982
41.057
-0.735
-1.76%
jan 1, 1983
38.567
-2.49
-6.06%
jan 1, 1984
38.952
+0.385
1.0%
jan 1, 1985
39.233
+0.282
0.72%
jan 1, 1986
39.234
+0.001
0.0%
jan 1, 1987
39.234
-0.001
0.0%
jan 1, 1988
38.527
-0.706
-1.8%
jan 1, 1989
38.357
-0.171
-0.44%
jan 1, 1990
39.804
+1.447
3.77%
jan 1, 1991
42.198
+2.394
6.01%
jan 1, 1992
42.106
-0.092
-0.22%
jan 1, 1993
41.145
-0.962
-2.28%
jan 1, 1994
40.085
-1.059
-2.57%
jan 1, 1995
40.041
-0.044
-0.11%
jan 1, 1996
41.403
+1.361
3.4%
jan 1, 1997
43.527
+2.125
5.13%
jan 1, 1998
44.574
+1.046
2.4%
jan 1, 1999
43.876
-0.697
-1.56%
jan 1, 2000
46.46
+2.583
5.89%
jan 1, 2001
48.32
+1.86
4.0%
jan 1, 2002
46.204
-2.116
-4.38%
jan 1, 2003
45.116
-1.088
-2.35%
jan 1, 2004
46.578
+1.463
3.24%
jan 1, 2005
48.53
+1.951
4.19%
jan 1, 2006
45.927
-2.603
-5.36%
jan 1, 2007
46.096
+0.169
0.37%
jan 1, 2008
42.215
-3.881
-8.42%
jan 1, 2009
42.916
+0.701
1.66%
jan 1, 2010
38.463
-4.453
-10.38%
jan 1, 2011
37.8
-0.664
-1.73%
jan 1, 2012
37.227
-0.572
-1.51%
jan 1, 2013
37.489
+0.262
0.7%
jan 1, 2014
37.191
-0.298
-0.79%
jan 1, 2015
37.168
-0.024
-0.06%
jan 1, 2016
36.43
-0.737
-1.98%
Ranking of countries by current statistics by years


Comments: