29
/
en
AIzaSyAYiBZKx7MnpbEhh9jyipgxe19OcubqV5w
April 1, 2024
163896
Japan
JPN
true
2
1
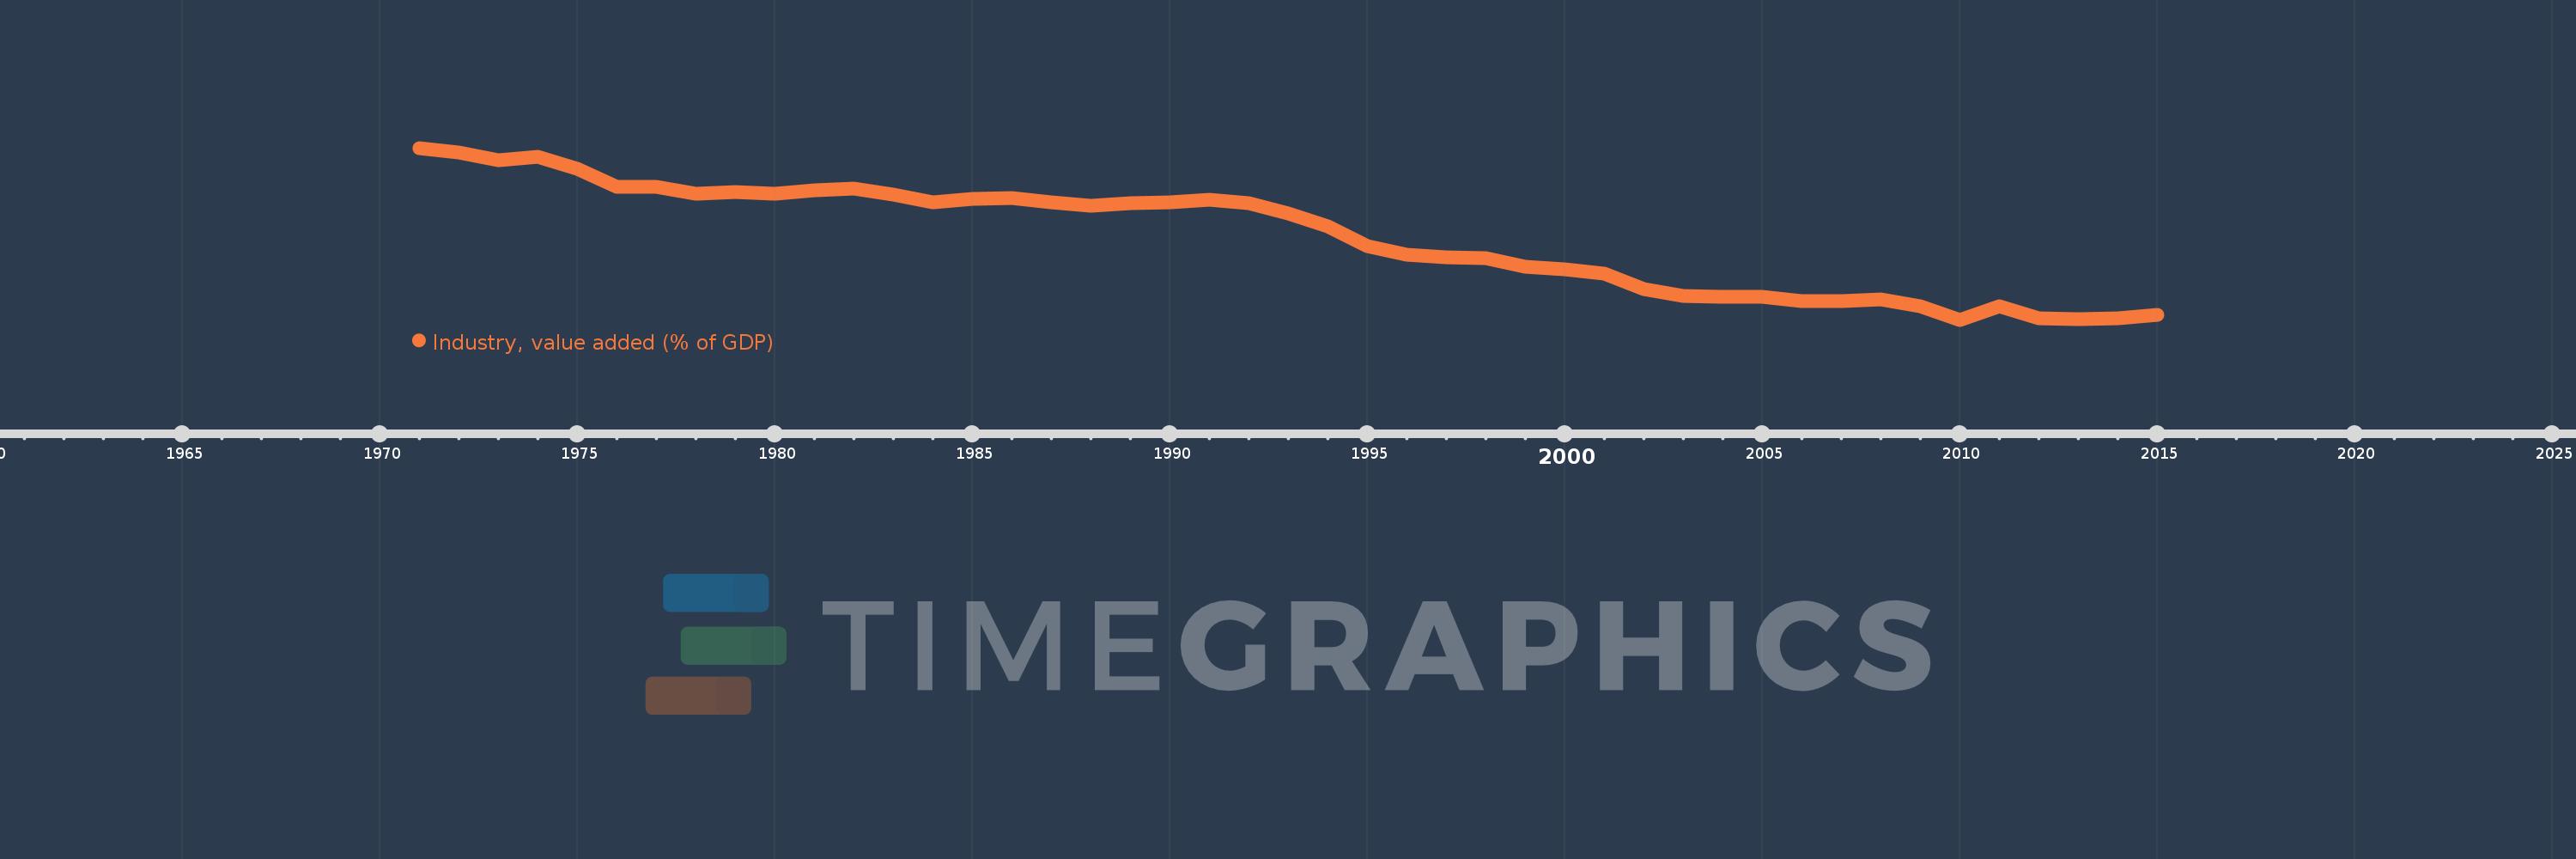
Industry, value added (% of GDP)
2015,2014,2013,2012,2011,2010,2009,2008,2007,2006,2005,2004,2003,2002,2001,2000,1999,1998,1997,1996,1995,1994,1993,1992,1991,1990,1989,1988,1987,1986,1985,1984,1983,1982,1981,1980,1979,1978,1977,1976,1975,1974,1973,1972,1971
This statistics in other country:
AfghanistanAlbaniaAlgeriaAndorraAngolaAntigua and BarbudaArab WorldArgentinaArmeniaArubaAustraliaAustriaAzerbaijanBahamas, TheBahrainBangladeshBarbadosBelarusBelgiumBelizeBeninBermudaBhutanBoliviaBosnia and HerzegovinaBotswanaBrazilBrunei DarussalamBulgariaBurkina FasoBurundiCabo VerdeCambodiaCameroonCanadaCaribbean small statesCayman IslandsCentral African RepublicCentral Europe and the BalticsChadChileChinaColombiaComorosCongo, Dem. Rep.Congo, Rep.Costa RicaCote d'IvoireCroatiaCubaCyprusCzech RepublicDenmarkDjiboutiDominicaDominican RepublicEarly-demographic dividendEast Asia & PacificEast Asia & Pacific (excluding high income)East Asia & Pacific (IDA & IBRD countries)EcuadorEgypt, Arab Rep.El SalvadorEquatorial GuineaEritreaEstoniaEthiopiaEuro areaEurope & Central AsiaEurope & Central Asia (excluding high income)Europe & Central Asia (IDA & IBRD countries)European UnionFijiFinlandFragile and conflict affected situationsFranceGabonGambia, TheGeorgiaGermanyGhanaGreeceGrenadaGuatemalaGuineaGuinea-BissauGuyanaHeavily indebted poor countries (HIPC)High incomeHondurasHong Kong SAR, ChinaHungaryIBRD onlyIcelandIDA & IBRD totalIDA blendIDA onlyIDA totalIndiaIndonesiaIran, Islamic Rep.IrelandItalyJamaicaJapanJordanKazakhstanKenyaKiribatiKorea, Rep.KosovoKuwaitKyrgyz RepublicLao PDRLate-demographic dividendLatin America & Caribbean Latin America & Caribbean (excluding high income)Latin America & the Caribbean (IDA & IBRD countries)LatviaLeast developed countries: UN classificationLebanonLesothoLibyaLiechtensteinLithuaniaLow & middle incomeLow incomeLower middle incomeLuxembourgMacao SAR, ChinaMacedonia, FYRMadagascarMalawiMalaysiaMaldivesMaliMaltaMarshall IslandsMauritaniaMauritiusMexicoMicronesia, Fed. Sts.Middle East & North AfricaMiddle East & North Africa (excluding high income)Middle East & North Africa (IDA & IBRD countries)Middle incomeMoldovaMongoliaMontenegroMoroccoMozambiqueMyanmarNamibiaNepalNetherlandsNew CaledoniaNew ZealandNicaraguaNigerNigeriaNorth AmericaNorwayOECD membersOmanOther small statesPacific island small statesPakistanPalauPanamaPapua New GuineaParaguayPeruPhilippinesPolandPortugalPost-demographic dividendPre-demographic dividendPuerto RicoQatarRomaniaRussian FederationRwandaSao Tome and PrincipeSaudi ArabiaSenegalSerbiaSeychellesSierra LeoneSingaporeSlovak RepublicSloveniaSmall statesSolomon IslandsSomaliaSouth AfricaSouth AsiaSouth Asia (IDA & IBRD)SpainSri LankaSt. Kitts and NevisSt. LuciaSt. Vincent and the GrenadinesSub-Saharan Africa Sub-Saharan Africa (excluding high income)Sub-Saharan Africa (IDA & IBRD countries)SudanSurinameSwazilandSwedenSwitzerlandSyrian Arab RepublicTajikistanTanzaniaThailandTimor-LesteTogoTongaTrinidad and TobagoTunisiaTurkeyTurkmenistanTuvaluUgandaUkraineUnited KingdomUnited StatesUpper middle incomeUruguayUzbekistanVanuatuVenezuela, RBVietnamWest Bank and GazaWorldYemen, Rep.ZambiaZimbabwe Timeline:
This timeline shows a graph from 1971 to 2015 of Japan. No data until 1970. Number of actual observations by date: 45.
Source name:
World Development Indicators
Source organization:
World Bank national accounts data, and OECD National Accounts data files.
Categories, topics:
Economy & Growth
Last updated:
apr 23, 2017
Indicators value changes by year
Minimum:
24.965
jan 1, 2010
Maximum:
43.671
jan 1, 1971
At the date of observation
Value
Absolute change
Change from previous value
jan 1, 1971
43.671
+43.671
0.0%
jan 1, 1972
43.222
-0.449
-1.03%
jan 1, 1973
42.346
-0.876
-2.03%
jan 1, 1974
42.703
+0.357
0.84%
jan 1, 1975
41.366
-1.337
-3.13%
jan 1, 1976
39.411
-1.955
-4.73%
jan 1, 1977
39.396
-0.015
-0.04%
jan 1, 1978
38.646
-0.749
-1.9%
jan 1, 1979
38.905
+0.258
0.67%
jan 1, 1980
38.654
-0.251
-0.64%
jan 1, 1981
39.058
+0.404
1.05%
jan 1, 1982
39.221
+0.163
0.42%
jan 1, 1983
38.569
-0.652
-1.66%
jan 1, 1984
37.745
-0.824
-2.14%
jan 1, 1985
38.17
+0.425
1.13%
jan 1, 1986
38.227
+0.057
0.15%
jan 1, 1987
37.78
-0.446
-1.17%
jan 1, 1988
37.341
-0.44
-1.16%
jan 1, 1989
37.633
+0.292
0.78%
jan 1, 1990
37.786
+0.153
0.41%
jan 1, 1991
38.054
+0.268
0.71%
jan 1, 1992
37.693
-0.361
-0.95%
jan 1, 1993
36.53
-1.163
-3.09%
jan 1, 1994
35.149
-1.38
-3.78%
jan 1, 1995
32.974
-2.175
-6.19%
jan 1, 1996
32.016
-0.959
-2.91%
jan 1, 1997
31.726
-0.289
-0.9%
jan 1, 1998
31.7
-0.027
-0.08%
jan 1, 1999
30.729
-0.971
-3.06%
jan 1, 2000
30.43
-0.299
-0.97%
jan 1, 2001
30.003
-0.426
-1.4%
jan 1, 2002
28.284
-1.72
-5.73%
jan 1, 2003
27.584
-0.7
-2.48%
jan 1, 2004
27.498
-0.086
-0.31%
jan 1, 2005
27.435
-0.062
-0.23%
jan 1, 2006
26.967
-0.468
-1.71%
jan 1, 2007
26.975
+0.008
0.03%
jan 1, 2008
27.155
+0.18
0.67%
jan 1, 2009
26.395
-0.76
-2.8%
jan 1, 2010
24.965
-1.43
-5.42%
jan 1, 2011
26.468
+1.504
6.02%
jan 1, 2012
25.099
-1.37
-5.17%
jan 1, 2013
25.009
-0.089
-0.36%
jan 1, 2014
25.096
+0.086
0.35%
jan 1, 2015
25.473
+0.377
1.5%
Ranking of countries by current statistics by years


Comments: