29
/
en
AIzaSyAYiBZKx7MnpbEhh9jyipgxe19OcubqV5w
April 1, 2024
111082
Congo, Rep.
COG
true
2
1
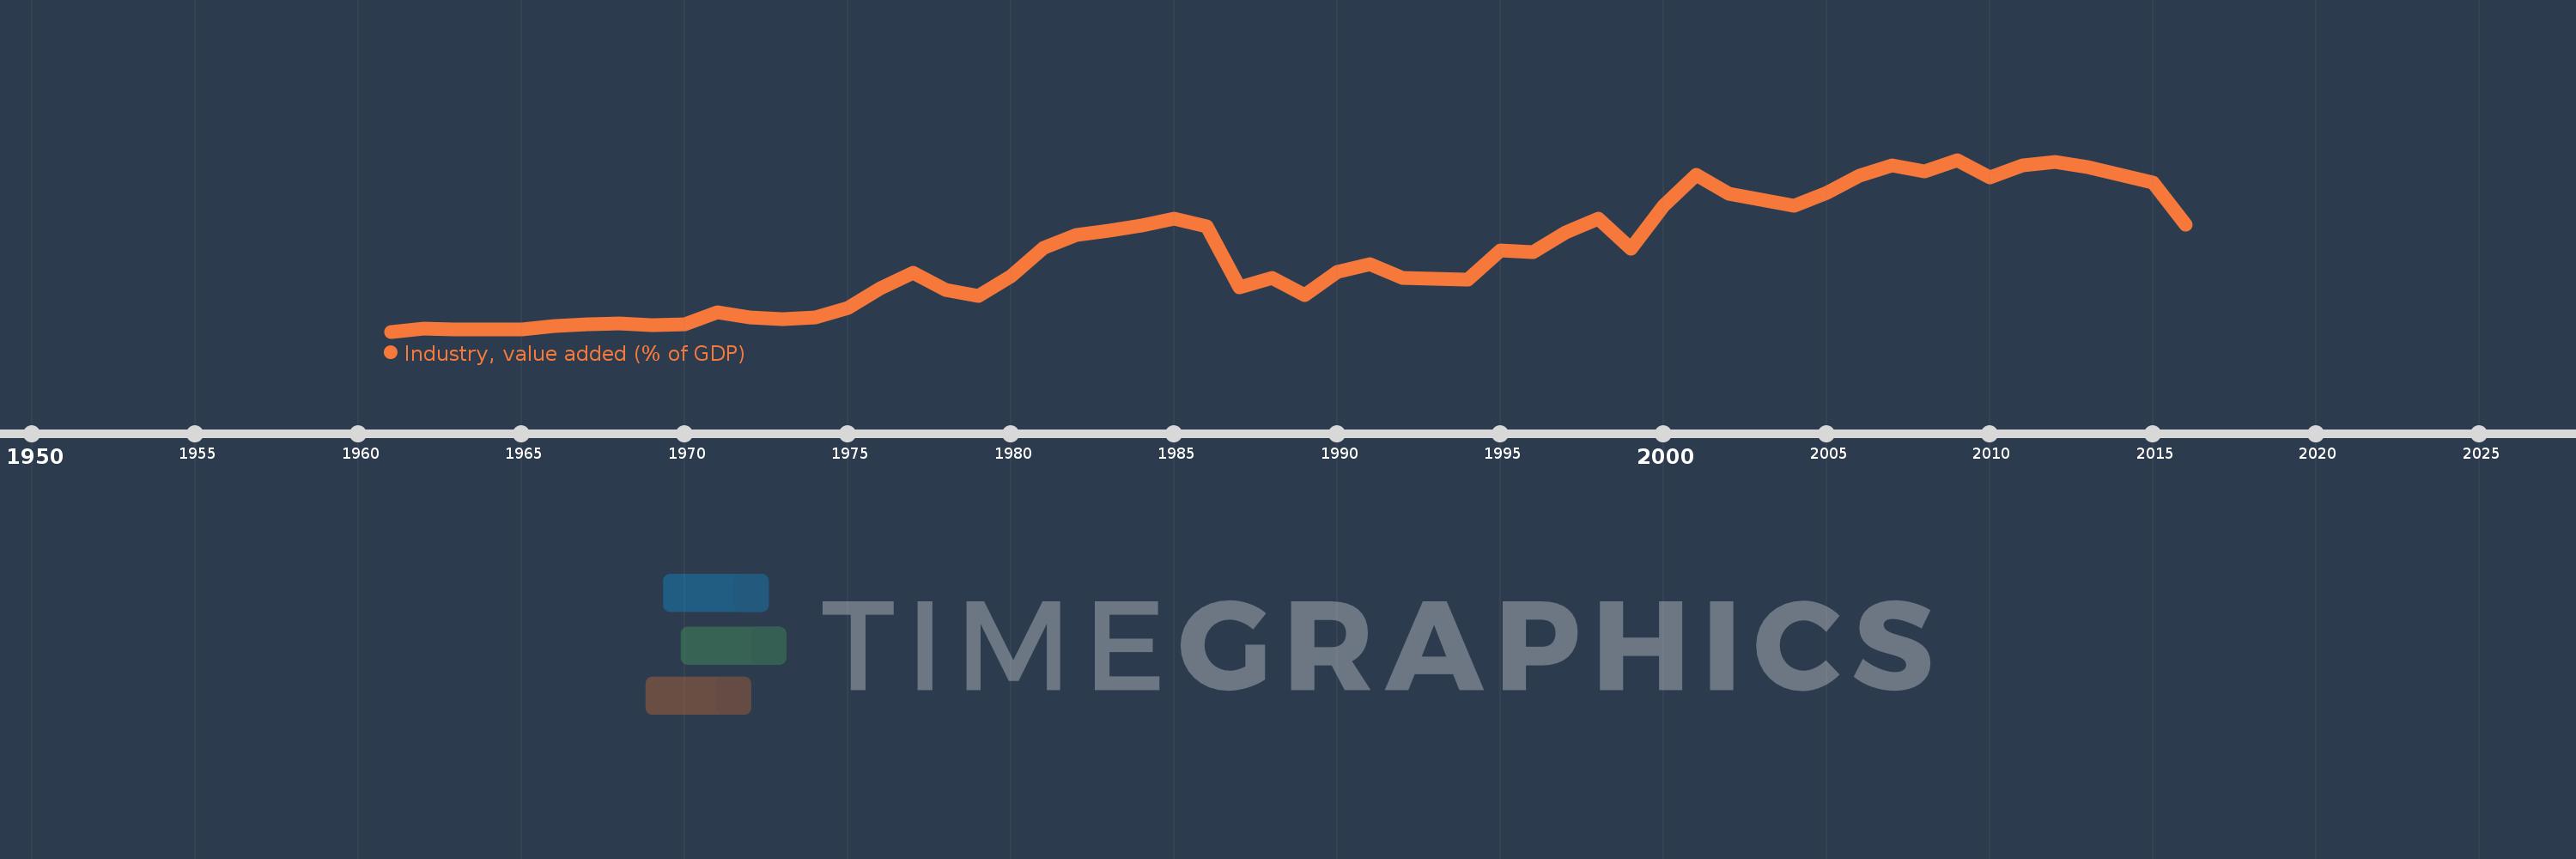
Industry, value added (% of GDP)
2016,2015,2014,2013,2012,2011,2010,2009,2008,2007,2006,2005,2004,2003,2002,2001,2000,1999,1998,1997,1996,1995,1994,1993,1992,1991,1990,1989,1988,1987,1986,1985,1984,1983,1982,1981,1980,1979,1978,1977,1976,1975,1974,1973,1972,1971,1970,1969,1968,1967,1966,1965,1964,1963,1962,1961
This statistics in other country:
AfghanistanAlbaniaAlgeriaAndorraAngolaAntigua and BarbudaArab WorldArgentinaArmeniaArubaAustraliaAustriaAzerbaijanBahamas, TheBahrainBangladeshBarbadosBelarusBelgiumBelizeBeninBermudaBhutanBoliviaBosnia and HerzegovinaBotswanaBrazilBrunei DarussalamBulgariaBurkina FasoBurundiCabo VerdeCambodiaCameroonCanadaCaribbean small statesCayman IslandsCentral African RepublicCentral Europe and the BalticsChadChileChinaColombiaComorosCongo, Dem. Rep.Congo, Rep.Costa RicaCote d'IvoireCroatiaCubaCyprusCzech RepublicDenmarkDjiboutiDominicaDominican RepublicEarly-demographic dividendEast Asia & PacificEast Asia & Pacific (excluding high income)East Asia & Pacific (IDA & IBRD countries)EcuadorEgypt, Arab Rep.El SalvadorEquatorial GuineaEritreaEstoniaEthiopiaEuro areaEurope & Central AsiaEurope & Central Asia (excluding high income)Europe & Central Asia (IDA & IBRD countries)European UnionFijiFinlandFragile and conflict affected situationsFranceGabonGambia, TheGeorgiaGermanyGhanaGreeceGrenadaGuatemalaGuineaGuinea-BissauGuyanaHeavily indebted poor countries (HIPC)High incomeHondurasHong Kong SAR, ChinaHungaryIBRD onlyIcelandIDA & IBRD totalIDA blendIDA onlyIDA totalIndiaIndonesiaIran, Islamic Rep.IrelandItalyJamaicaJapanJordanKazakhstanKenyaKiribatiKorea, Rep.KosovoKuwaitKyrgyz RepublicLao PDRLate-demographic dividendLatin America & Caribbean Latin America & Caribbean (excluding high income)Latin America & the Caribbean (IDA & IBRD countries)LatviaLeast developed countries: UN classificationLebanonLesothoLibyaLiechtensteinLithuaniaLow & middle incomeLow incomeLower middle incomeLuxembourgMacao SAR, ChinaMacedonia, FYRMadagascarMalawiMalaysiaMaldivesMaliMaltaMarshall IslandsMauritaniaMauritiusMexicoMicronesia, Fed. Sts.Middle East & North AfricaMiddle East & North Africa (excluding high income)Middle East & North Africa (IDA & IBRD countries)Middle incomeMoldovaMongoliaMontenegroMoroccoMozambiqueMyanmarNamibiaNepalNetherlandsNew CaledoniaNew ZealandNicaraguaNigerNigeriaNorth AmericaNorwayOECD membersOmanOther small statesPacific island small statesPakistanPalauPanamaPapua New GuineaParaguayPeruPhilippinesPolandPortugalPost-demographic dividendPre-demographic dividendPuerto RicoQatarRomaniaRussian FederationRwandaSao Tome and PrincipeSaudi ArabiaSenegalSerbiaSeychellesSierra LeoneSingaporeSlovak RepublicSloveniaSmall statesSolomon IslandsSomaliaSouth AfricaSouth AsiaSouth Asia (IDA & IBRD)SpainSri LankaSt. Kitts and NevisSt. LuciaSt. Vincent and the GrenadinesSub-Saharan Africa Sub-Saharan Africa (excluding high income)Sub-Saharan Africa (IDA & IBRD countries)SudanSurinameSwazilandSwedenSwitzerlandSyrian Arab RepublicTajikistanTanzaniaThailandTimor-LesteTogoTongaTrinidad and TobagoTunisiaTurkeyTurkmenistanTuvaluUgandaUkraineUnited KingdomUnited StatesUpper middle incomeUruguayUzbekistanVanuatuVenezuela, RBVietnamWest Bank and GazaWorldYemen, Rep.ZambiaZimbabwe Timeline:
This timeline shows a graph from 1961 to 2016 of Congo, Rep.. No data until 1960. Number of actual observations by date: 56.
Source name:
World Development Indicators
Source organization:
World Bank national accounts data, and OECD National Accounts data files.
Categories, topics:
Economy & Growth
Last updated:
apr 23, 2017
Indicators value changes by year
Minimum:
17.028
jan 1, 1961
Maximum:
77.414
jan 1, 2009
At the date of observation
Value
Absolute change
Change from previous value
jan 1, 1961
17.028
+17.028
0.0%
jan 1, 1962
18.011
+0.983
5.77%
jan 1, 1963
17.892
-0.119
-0.66%
jan 1, 1964
17.773
-0.12
-0.67%
jan 1, 1965
17.802
+0.03
0.17%
jan 1, 1966
18.93
+1.128
6.34%
jan 1, 1967
19.742
+0.812
4.29%
jan 1, 1968
19.863
+0.121
0.61%
jan 1, 1969
19.293
-0.57
-2.87%
jan 1, 1970
19.448
+0.156
0.81%
jan 1, 1971
23.947
+4.499
23.13%
jan 1, 1972
21.871
-2.076
-8.67%
jan 1, 1973
21.256
-0.615
-2.81%
jan 1, 1974
22.103
+0.847
3.98%
jan 1, 1975
25.408
+3.305
14.95%
jan 1, 1976
32.421
+7.013
27.6%
jan 1, 1977
37.604
+5.183
15.99%
jan 1, 1978
31.649
-5.955
-15.84%
jan 1, 1979
29.501
-2.148
-6.79%
jan 1, 1980
36.392
+6.891
23.36%
jan 1, 1981
46.615
+10.223
28.09%
jan 1, 1982
50.895
+4.28
9.18%
jan 1, 1983
52.563
+1.668
3.28%
jan 1, 1984
54.329
+1.766
3.36%
jan 1, 1985
56.588
+2.259
4.16%
jan 1, 1986
53.914
-2.674
-4.73%
jan 1, 1987
32.646
-21.268
-39.45%
jan 1, 1988
35.788
+3.142
9.63%
jan 1, 1989
29.916
-5.872
-16.41%
jan 1, 1990
37.979
+8.063
26.95%
jan 1, 1991
40.643
+2.664
7.01%
jan 1, 1992
36.035
-4.608
-11.34%
jan 1, 1993
35.51
-0.525
-1.46%
jan 1, 1994
35.298
-0.212
-0.6%
jan 1, 1995
45.484
+10.186
28.86%
jan 1, 1996
44.868
-0.616
-1.35%
jan 1, 1997
51.843
+6.974
15.54%
jan 1, 1998
56.864
+5.021
9.68%
jan 1, 1999
46.057
-10.807
-19.0%
jan 1, 2000
61.271
+15.214
33.03%
jan 1, 2001
72.153
+10.882
17.76%
jan 1, 2002
65.488
-6.664
-9.24%
jan 1, 2003
63.319
-2.17
-3.31%
jan 1, 2004
61.172
-2.147
-3.39%
jan 1, 2005
65.864
+4.692
7.67%
jan 1, 2006
71.882
+6.017
9.14%
jan 1, 2007
75.501
+3.619
5.04%
jan 1, 2008
73.241
-2.26
-2.99%
jan 1, 2009
77.414
+4.173
5.7%
jan 1, 2010
71.117
-6.297
-8.13%
jan 1, 2011
75.377
+4.26
5.99%
jan 1, 2012
76.626
+1.248
1.66%
jan 1, 2013
74.768
-1.858
-2.42%
jan 1, 2014
72.016
-2.752
-3.68%
jan 1, 2015
69.417
-2.599
-3.61%
jan 1, 2016
54.674
-14.743
-21.24%
Ranking of countries by current statistics by years


Comments: