29
/
en
AIzaSyAYiBZKx7MnpbEhh9jyipgxe19OcubqV5w
April 1, 2024
93713
Bulgaria
BGR
true
2
1
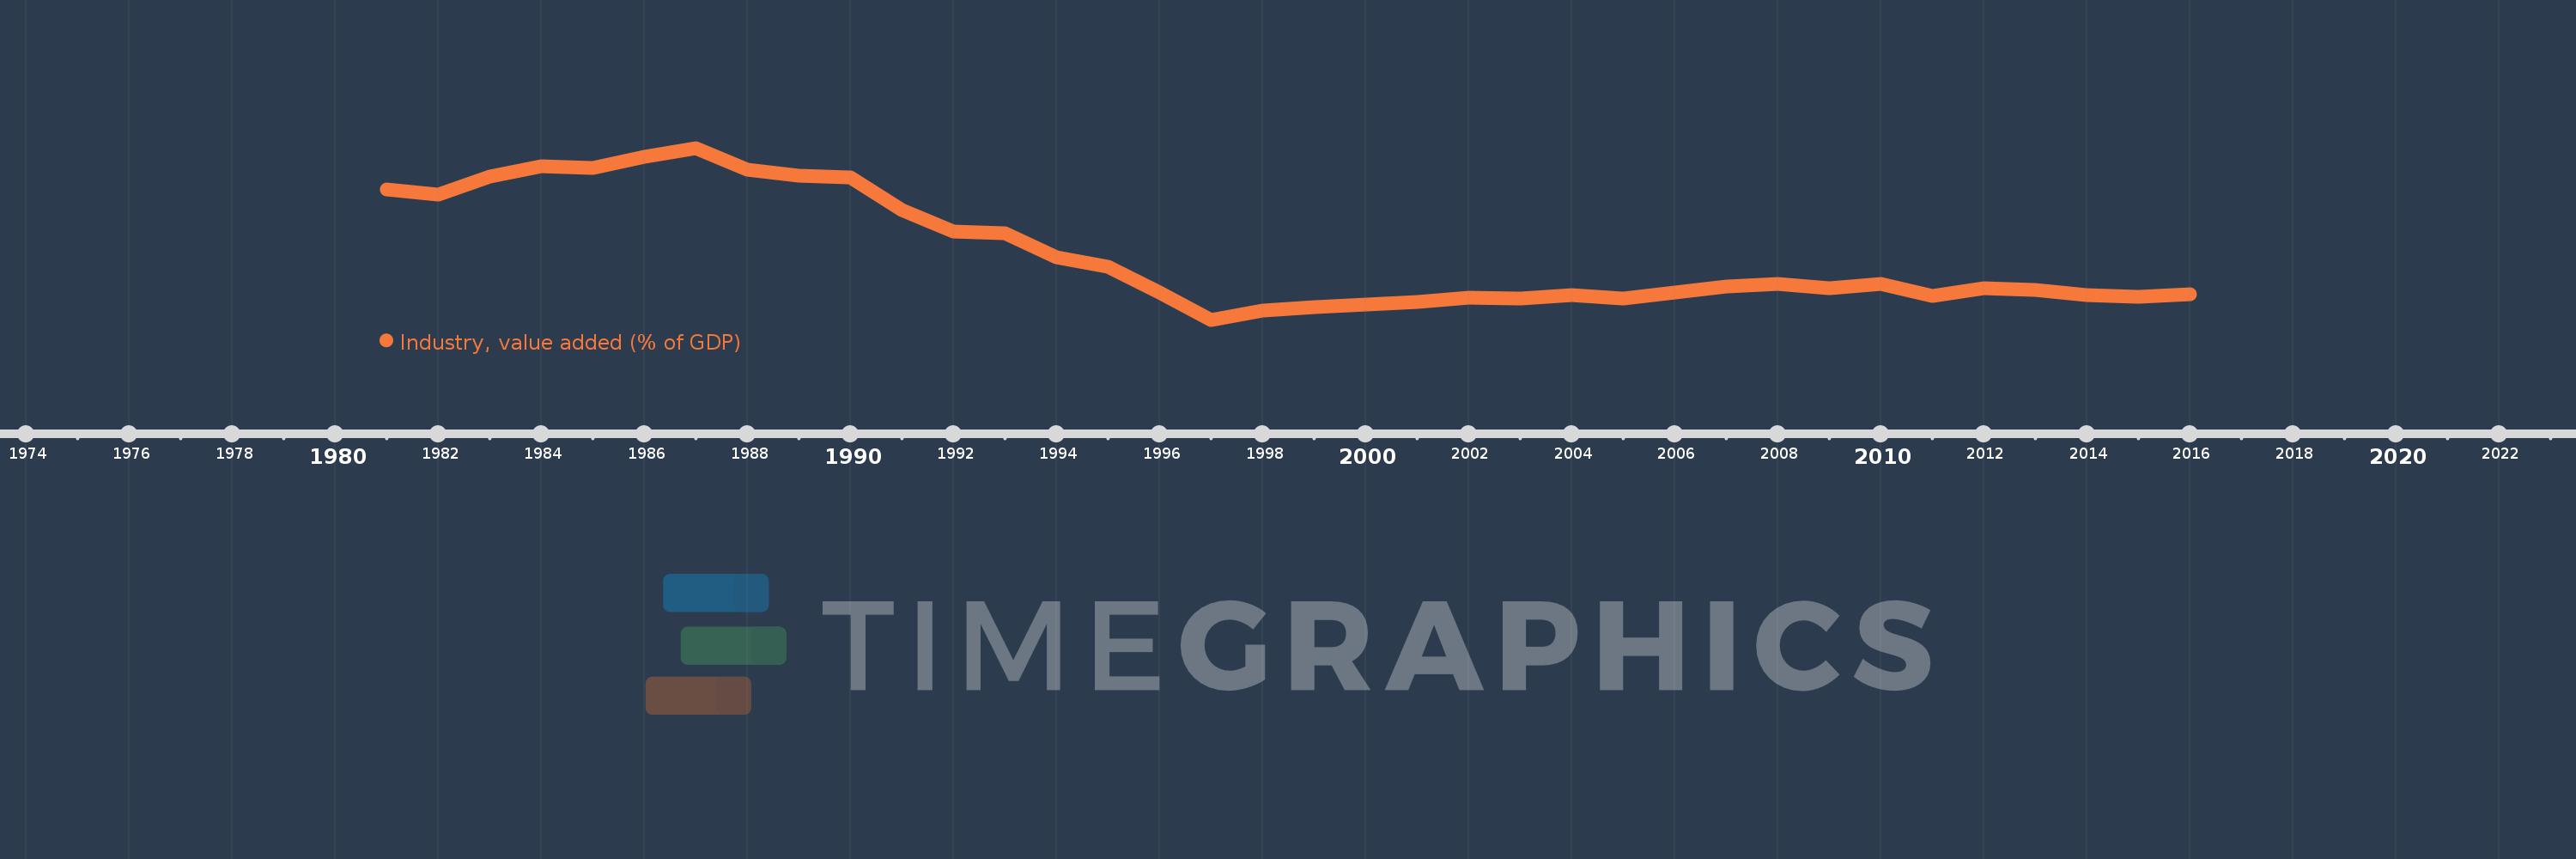
Industry, value added (% of GDP)
2016,2015,2014,2013,2012,2011,2010,2009,2008,2007,2006,2005,2004,2003,2002,2001,2000,1999,1998,1997,1996,1995,1994,1993,1992,1991,1990,1989,1988,1987,1986,1985,1984,1983,1982,1981
This statistics in other country:
AfghanistanAlbaniaAlgeriaAndorraAngolaAntigua and BarbudaArab WorldArgentinaArmeniaArubaAustraliaAustriaAzerbaijanBahamas, TheBahrainBangladeshBarbadosBelarusBelgiumBelizeBeninBermudaBhutanBoliviaBosnia and HerzegovinaBotswanaBrazilBrunei DarussalamBulgariaBurkina FasoBurundiCabo VerdeCambodiaCameroonCanadaCaribbean small statesCayman IslandsCentral African RepublicCentral Europe and the BalticsChadChileChinaColombiaComorosCongo, Dem. Rep.Congo, Rep.Costa RicaCote d'IvoireCroatiaCubaCyprusCzech RepublicDenmarkDjiboutiDominicaDominican RepublicEarly-demographic dividendEast Asia & PacificEast Asia & Pacific (excluding high income)East Asia & Pacific (IDA & IBRD countries)EcuadorEgypt, Arab Rep.El SalvadorEquatorial GuineaEritreaEstoniaEthiopiaEuro areaEurope & Central AsiaEurope & Central Asia (excluding high income)Europe & Central Asia (IDA & IBRD countries)European UnionFijiFinlandFragile and conflict affected situationsFranceGabonGambia, TheGeorgiaGermanyGhanaGreeceGrenadaGuatemalaGuineaGuinea-BissauGuyanaHeavily indebted poor countries (HIPC)High incomeHondurasHong Kong SAR, ChinaHungaryIBRD onlyIcelandIDA & IBRD totalIDA blendIDA onlyIDA totalIndiaIndonesiaIran, Islamic Rep.IrelandItalyJamaicaJapanJordanKazakhstanKenyaKiribatiKorea, Rep.KosovoKuwaitKyrgyz RepublicLao PDRLate-demographic dividendLatin America & Caribbean Latin America & Caribbean (excluding high income)Latin America & the Caribbean (IDA & IBRD countries)LatviaLeast developed countries: UN classificationLebanonLesothoLibyaLiechtensteinLithuaniaLow & middle incomeLow incomeLower middle incomeLuxembourgMacao SAR, ChinaMacedonia, FYRMadagascarMalawiMalaysiaMaldivesMaliMaltaMarshall IslandsMauritaniaMauritiusMexicoMicronesia, Fed. Sts.Middle East & North AfricaMiddle East & North Africa (excluding high income)Middle East & North Africa (IDA & IBRD countries)Middle incomeMoldovaMongoliaMontenegroMoroccoMozambiqueMyanmarNamibiaNepalNetherlandsNew CaledoniaNew ZealandNicaraguaNigerNigeriaNorth AmericaNorwayOECD membersOmanOther small statesPacific island small statesPakistanPalauPanamaPapua New GuineaParaguayPeruPhilippinesPolandPortugalPost-demographic dividendPre-demographic dividendPuerto RicoQatarRomaniaRussian FederationRwandaSao Tome and PrincipeSaudi ArabiaSenegalSerbiaSeychellesSierra LeoneSingaporeSlovak RepublicSloveniaSmall statesSolomon IslandsSomaliaSouth AfricaSouth AsiaSouth Asia (IDA & IBRD)SpainSri LankaSt. Kitts and NevisSt. LuciaSt. Vincent and the GrenadinesSub-Saharan Africa Sub-Saharan Africa (excluding high income)Sub-Saharan Africa (IDA & IBRD countries)SudanSurinameSwazilandSwedenSwitzerlandSyrian Arab RepublicTajikistanTanzaniaThailandTimor-LesteTogoTongaTrinidad and TobagoTunisiaTurkeyTurkmenistanTuvaluUgandaUkraineUnited KingdomUnited StatesUpper middle incomeUruguayUzbekistanVanuatuVenezuela, RBVietnamWest Bank and GazaWorldYemen, Rep.ZambiaZimbabwe Timeline:
This timeline shows a graph from 1981 to 2016 of Bulgaria. No data until 1980. Number of actual observations by date: 36.
Source name:
World Development Indicators
Source organization:
World Bank national accounts data, and OECD National Accounts data files.
Categories, topics:
Economy & Growth
Last updated:
apr 23, 2017
Indicators value changes by year
Minimum:
21.348
jan 1, 1997
Maximum:
65.117
jan 1, 1987
At the date of observation
Value
Absolute change
Change from previous value
jan 1, 1981
54.49
+54.49
0.0%
jan 1, 1982
53.233
-1.257
-2.31%
jan 1, 1983
57.868
+4.634
8.71%
jan 1, 1984
60.383
+2.516
4.35%
jan 1, 1985
60.049
-0.334
-0.55%
jan 1, 1986
62.822
+2.773
4.62%
jan 1, 1987
65.117
+2.295
3.65%
jan 1, 1988
59.49
-5.627
-8.64%
jan 1, 1989
58.118
-1.372
-2.31%
jan 1, 1990
57.62
-0.498
-0.86%
jan 1, 1991
49.197
-8.423
-14.62%
jan 1, 1992
43.761
-5.436
-11.05%
jan 1, 1993
43.493
-0.268
-0.61%
jan 1, 1994
37.184
-6.309
-14.5%
jan 1, 1995
34.772
-2.412
-6.49%
jan 1, 1996
28.365
-6.407
-18.42%
jan 1, 1997
21.348
-7.018
-24.74%
jan 1, 1998
23.671
+2.323
10.88%
jan 1, 1999
24.608
+0.936
3.96%
jan 1, 2000
25.147
+0.539
2.19%
jan 1, 2001
25.846
+0.699
2.78%
jan 1, 2002
26.897
+1.051
4.07%
jan 1, 2003
26.694
-0.203
-0.76%
jan 1, 2004
27.522
+0.829
3.1%
jan 1, 2005
26.656
-0.866
-3.15%
jan 1, 2006
28.238
+1.581
5.93%
jan 1, 2007
29.757
+1.519
5.38%
jan 1, 2008
30.531
+0.774
2.6%
jan 1, 2009
29.472
-1.059
-3.47%
jan 1, 2010
30.459
+0.987
3.35%
jan 1, 2011
27.379
-3.08
-10.11%
jan 1, 2012
29.29
+1.911
6.98%
jan 1, 2013
28.892
-0.398
-1.36%
jan 1, 2014
27.58
-1.312
-4.54%
jan 1, 2015
27.139
-0.442
-1.6%
jan 1, 2016
27.872
+0.734
2.7%
Ranking of countries by current statistics by years


Comments: