29
/
en
AIzaSyAYiBZKx7MnpbEhh9jyipgxe19OcubqV5w
April 1, 2024
245738
South Africa
ZAF
true
2
1
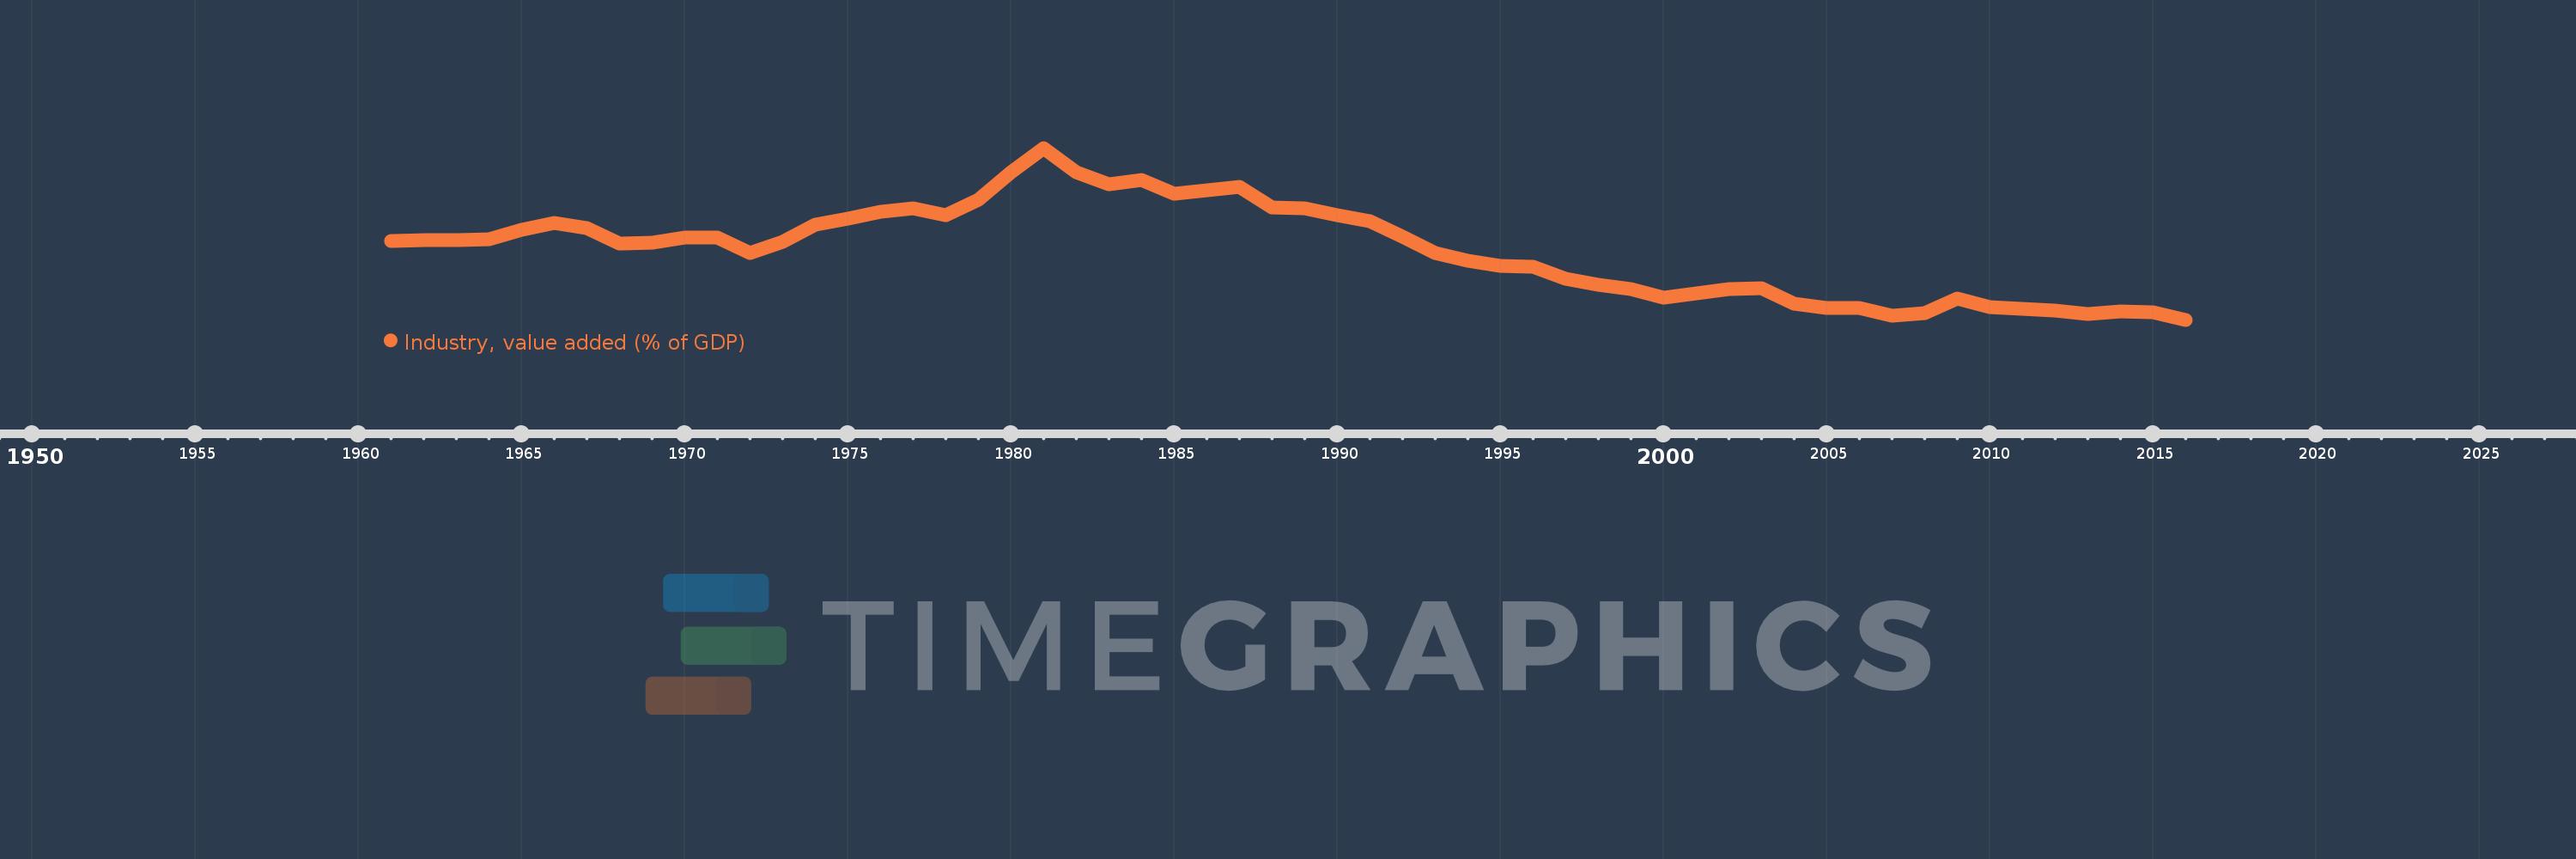
Industry, value added (% of GDP)
2016,2015,2014,2013,2012,2011,2010,2009,2008,2007,2006,2005,2004,2003,2002,2001,2000,1999,1998,1997,1996,1995,1994,1993,1992,1991,1990,1989,1988,1987,1986,1985,1984,1983,1982,1981,1980,1979,1978,1977,1976,1975,1974,1973,1972,1971,1970,1969,1968,1967,1966,1965,1964,1963,1962,1961
This statistics in other country:
AfghanistanAlbaniaAlgeriaAndorraAngolaAntigua and BarbudaArab WorldArgentinaArmeniaArubaAustraliaAustriaAzerbaijanBahamas, TheBahrainBangladeshBarbadosBelarusBelgiumBelizeBeninBermudaBhutanBoliviaBosnia and HerzegovinaBotswanaBrazilBrunei DarussalamBulgariaBurkina FasoBurundiCabo VerdeCambodiaCameroonCanadaCaribbean small statesCayman IslandsCentral African RepublicCentral Europe and the BalticsChadChileChinaColombiaComorosCongo, Dem. Rep.Congo, Rep.Costa RicaCote d'IvoireCroatiaCubaCyprusCzech RepublicDenmarkDjiboutiDominicaDominican RepublicEarly-demographic dividendEast Asia & PacificEast Asia & Pacific (excluding high income)East Asia & Pacific (IDA & IBRD countries)EcuadorEgypt, Arab Rep.El SalvadorEquatorial GuineaEritreaEstoniaEthiopiaEuro areaEurope & Central AsiaEurope & Central Asia (excluding high income)Europe & Central Asia (IDA & IBRD countries)European UnionFijiFinlandFragile and conflict affected situationsFranceGabonGambia, TheGeorgiaGermanyGhanaGreeceGrenadaGuatemalaGuineaGuinea-BissauGuyanaHeavily indebted poor countries (HIPC)High incomeHondurasHong Kong SAR, ChinaHungaryIBRD onlyIcelandIDA & IBRD totalIDA blendIDA onlyIDA totalIndiaIndonesiaIran, Islamic Rep.IrelandItalyJamaicaJapanJordanKazakhstanKenyaKiribatiKorea, Rep.KosovoKuwaitKyrgyz RepublicLao PDRLate-demographic dividendLatin America & Caribbean Latin America & Caribbean (excluding high income)Latin America & the Caribbean (IDA & IBRD countries)LatviaLeast developed countries: UN classificationLebanonLesothoLibyaLiechtensteinLithuaniaLow & middle incomeLow incomeLower middle incomeLuxembourgMacao SAR, ChinaMacedonia, FYRMadagascarMalawiMalaysiaMaldivesMaliMaltaMarshall IslandsMauritaniaMauritiusMexicoMicronesia, Fed. Sts.Middle East & North AfricaMiddle East & North Africa (excluding high income)Middle East & North Africa (IDA & IBRD countries)Middle incomeMoldovaMongoliaMontenegroMoroccoMozambiqueMyanmarNamibiaNepalNetherlandsNew CaledoniaNew ZealandNicaraguaNigerNigeriaNorth AmericaNorwayOECD membersOmanOther small statesPacific island small statesPakistanPalauPanamaPapua New GuineaParaguayPeruPhilippinesPolandPortugalPost-demographic dividendPre-demographic dividendPuerto RicoQatarRomaniaRussian FederationRwandaSao Tome and PrincipeSaudi ArabiaSenegalSerbiaSeychellesSierra LeoneSingaporeSlovak RepublicSloveniaSmall statesSolomon IslandsSomaliaSouth AfricaSouth AsiaSouth Asia (IDA & IBRD)SpainSri LankaSt. Kitts and NevisSt. LuciaSt. Vincent and the GrenadinesSub-Saharan Africa Sub-Saharan Africa (excluding high income)Sub-Saharan Africa (IDA & IBRD countries)SudanSurinameSwazilandSwedenSwitzerlandSyrian Arab RepublicTajikistanTanzaniaThailandTimor-LesteTogoTongaTrinidad and TobagoTunisiaTurkeyTurkmenistanTuvaluUgandaUkraineUnited KingdomUnited StatesUpper middle incomeUruguayUzbekistanVanuatuVenezuela, RBVietnamWest Bank and GazaWorldYemen, Rep.ZambiaZimbabwe Timeline:
This timeline shows a graph from 1961 to 2016 of South Africa. No data until 1960. Number of actual observations by date: 56.
Source name:
World Development Indicators
Source organization:
World Bank national accounts data, and OECD National Accounts data files.
Categories, topics:
Economy & Growth
Last updated:
apr 23, 2017
Indicators value changes by year
Maximum:
48.376
jan 1, 1981
At the date of observation
Value
Absolute change
Change from previous value
jan 1, 1961
37.817
+37.817
0.0%
jan 1, 1962
37.959
+0.142
0.37%
jan 1, 1963
37.938
-0.021
-0.05%
jan 1, 1964
38.014
+0.075
0.2%
jan 1, 1965
39.106
+1.093
2.87%
jan 1, 1966
39.84
+0.733
1.88%
jan 1, 1967
39.287
-0.553
-1.39%
jan 1, 1968
37.526
-1.76
-4.48%
jan 1, 1969
37.659
+0.133
0.35%
jan 1, 1970
38.252
+0.593
1.57%
jan 1, 1971
38.181
-0.071
-0.18%
jan 1, 1972
36.505
-1.676
-4.39%
jan 1, 1973
37.721
+1.215
3.33%
jan 1, 1974
39.666
+1.945
5.16%
jan 1, 1975
40.391
+0.726
1.83%
jan 1, 1976
41.176
+0.785
1.94%
jan 1, 1977
41.567
+0.39
0.95%
jan 1, 1978
40.743
-0.824
-1.98%
jan 1, 1979
42.483
+1.741
4.27%
jan 1, 1980
45.633
+3.149
7.41%
jan 1, 1981
48.376
+2.743
6.01%
jan 1, 1982
45.656
-2.719
-5.62%
jan 1, 1983
44.249
-1.407
-3.08%
jan 1, 1984
44.723
+0.474
1.07%
jan 1, 1985
43.186
-1.536
-3.44%
jan 1, 1986
43.616
+0.43
1.0%
jan 1, 1987
43.946
+0.33
0.76%
jan 1, 1988
41.657
-2.289
-5.21%
jan 1, 1989
41.546
-0.112
-0.27%
jan 1, 1990
40.72
-0.825
-1.99%
jan 1, 1991
40.097
-0.623
-1.53%
jan 1, 1992
38.359
-1.738
-4.33%
jan 1, 1993
36.423
-1.936
-5.05%
jan 1, 1994
35.548
-0.875
-2.4%
jan 1, 1995
35.005
-0.544
-1.53%
jan 1, 1996
34.87
-0.135
-0.39%
jan 1, 1997
33.587
-1.282
-3.68%
jan 1, 1998
32.88
-0.708
-2.11%
jan 1, 1999
32.357
-0.523
-1.59%
jan 1, 2000
31.355
-1.002
-3.1%
jan 1, 2001
31.894
+0.54
1.72%
jan 1, 2002
32.393
+0.498
1.56%
jan 1, 2003
32.507
+0.115
0.35%
jan 1, 2004
30.728
-1.779
-5.47%
jan 1, 2005
30.28
-0.448
-1.46%
jan 1, 2006
30.278
-0.003
-0.01%
jan 1, 2007
29.386
-0.892
-2.95%
jan 1, 2008
29.69
+0.304
1.04%
jan 1, 2009
31.353
+1.663
5.6%
jan 1, 2010
30.376
-0.977
-3.12%
jan 1, 2011
30.16
-0.216
-0.71%
jan 1, 2012
29.903
-0.257
-0.85%
jan 1, 2013
29.601
-0.302
-1.01%
jan 1, 2014
29.843
+0.242
0.82%
jan 1, 2015
29.732
-0.111
-0.37%
jan 1, 2016
28.9
-0.832
-2.8%
Ranking of countries by current statistics by years


Comments: