29
/
en
AIzaSyAYiBZKx7MnpbEhh9jyipgxe19OcubqV5w
April 1, 2024
254256
Suriname
SUR
true
2
1
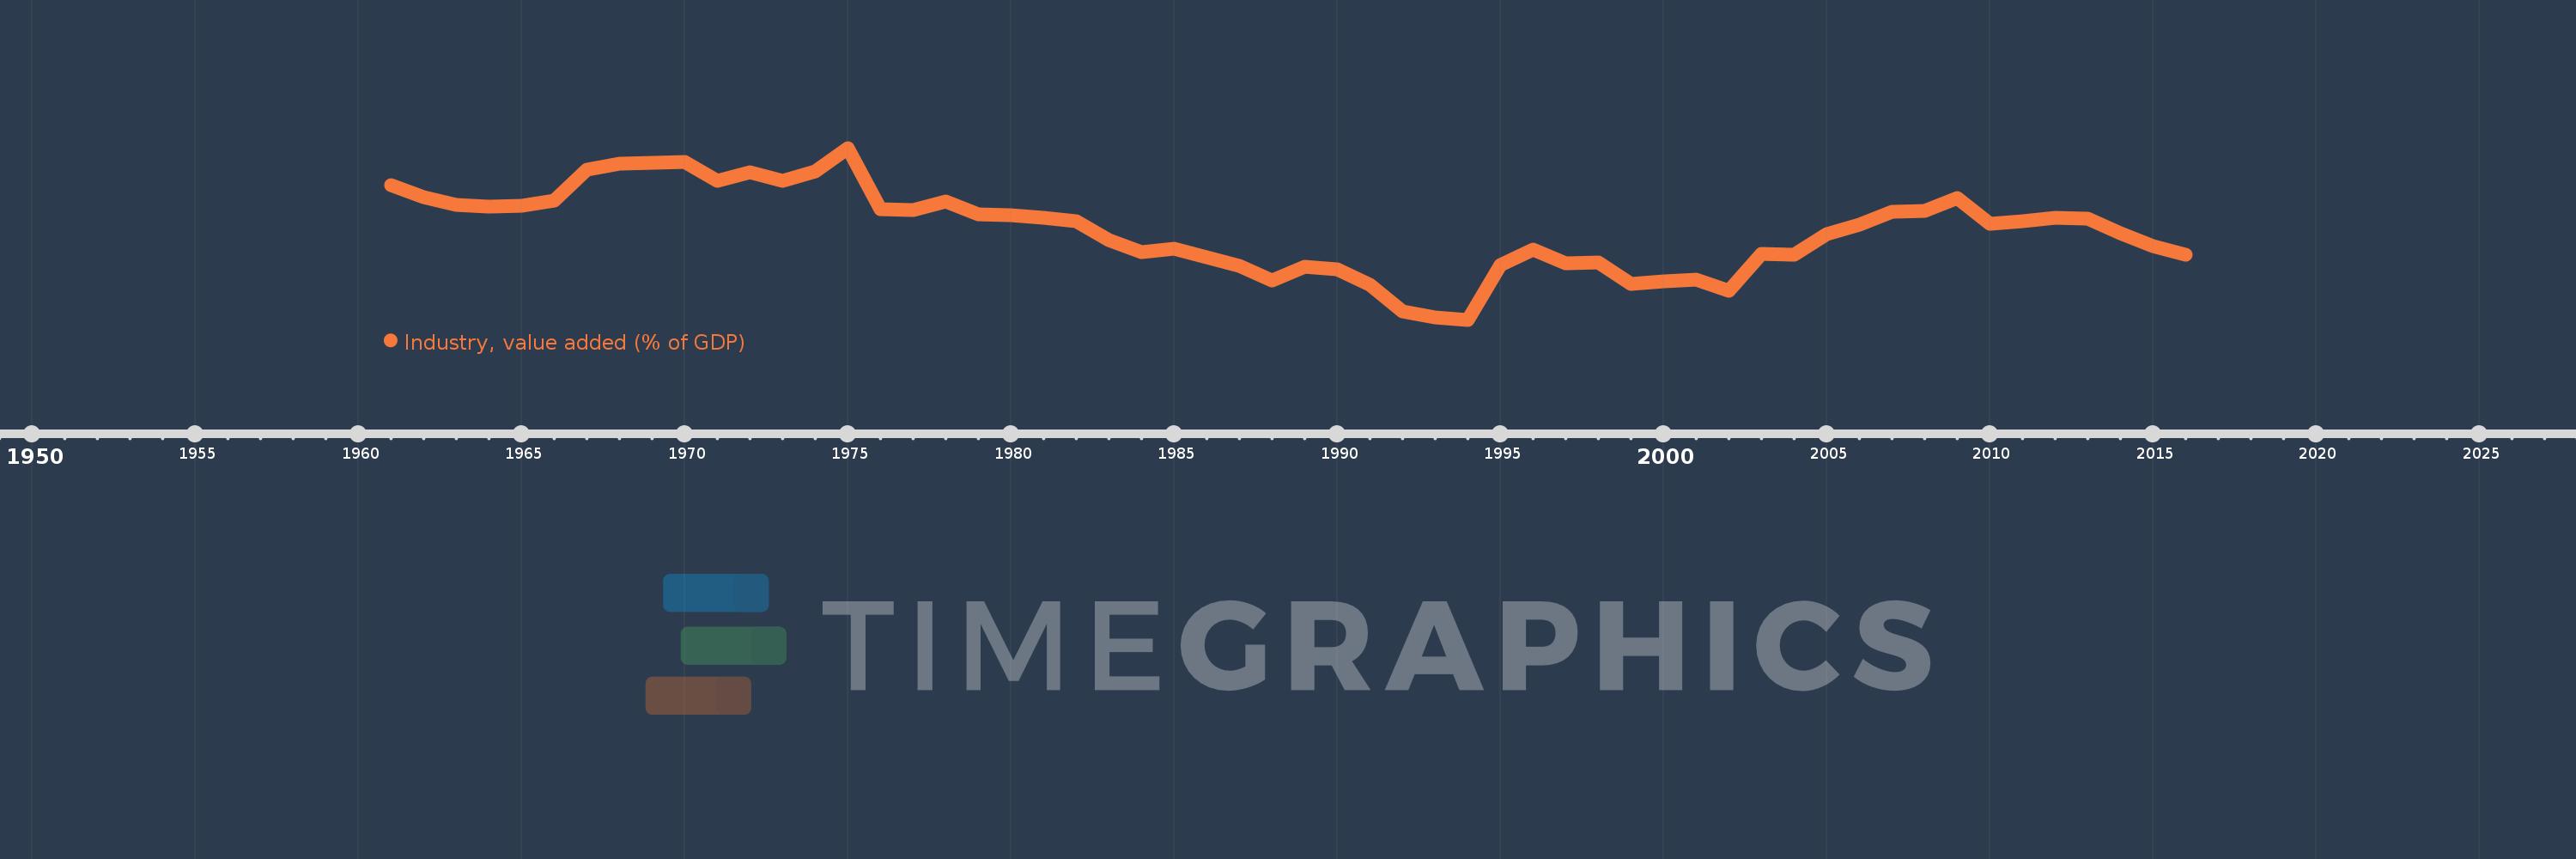
Industry, value added (% of GDP)
2016,2015,2014,2013,2012,2011,2010,2009,2008,2007,2006,2005,2004,2003,2002,2001,2000,1999,1998,1997,1996,1995,1994,1993,1992,1991,1990,1989,1988,1987,1986,1985,1984,1983,1982,1981,1980,1979,1978,1977,1976,1975,1974,1973,1972,1971,1970,1969,1968,1967,1966,1965,1964,1963,1962,1961
This statistics in other country:
AfghanistanAlbaniaAlgeriaAndorraAngolaAntigua and BarbudaArab WorldArgentinaArmeniaArubaAustraliaAustriaAzerbaijanBahamas, TheBahrainBangladeshBarbadosBelarusBelgiumBelizeBeninBermudaBhutanBoliviaBosnia and HerzegovinaBotswanaBrazilBrunei DarussalamBulgariaBurkina FasoBurundiCabo VerdeCambodiaCameroonCanadaCaribbean small statesCayman IslandsCentral African RepublicCentral Europe and the BalticsChadChileChinaColombiaComorosCongo, Dem. Rep.Congo, Rep.Costa RicaCote d'IvoireCroatiaCubaCyprusCzech RepublicDenmarkDjiboutiDominicaDominican RepublicEarly-demographic dividendEast Asia & PacificEast Asia & Pacific (excluding high income)East Asia & Pacific (IDA & IBRD countries)EcuadorEgypt, Arab Rep.El SalvadorEquatorial GuineaEritreaEstoniaEthiopiaEuro areaEurope & Central AsiaEurope & Central Asia (excluding high income)Europe & Central Asia (IDA & IBRD countries)European UnionFijiFinlandFragile and conflict affected situationsFranceGabonGambia, TheGeorgiaGermanyGhanaGreeceGrenadaGuatemalaGuineaGuinea-BissauGuyanaHeavily indebted poor countries (HIPC)High incomeHondurasHong Kong SAR, ChinaHungaryIBRD onlyIcelandIDA & IBRD totalIDA blendIDA onlyIDA totalIndiaIndonesiaIran, Islamic Rep.IrelandItalyJamaicaJapanJordanKazakhstanKenyaKiribatiKorea, Rep.KosovoKuwaitKyrgyz RepublicLao PDRLate-demographic dividendLatin America & Caribbean Latin America & Caribbean (excluding high income)Latin America & the Caribbean (IDA & IBRD countries)LatviaLeast developed countries: UN classificationLebanonLesothoLibyaLiechtensteinLithuaniaLow & middle incomeLow incomeLower middle incomeLuxembourgMacao SAR, ChinaMacedonia, FYRMadagascarMalawiMalaysiaMaldivesMaliMaltaMarshall IslandsMauritaniaMauritiusMexicoMicronesia, Fed. Sts.Middle East & North AfricaMiddle East & North Africa (excluding high income)Middle East & North Africa (IDA & IBRD countries)Middle incomeMoldovaMongoliaMontenegroMoroccoMozambiqueMyanmarNamibiaNepalNetherlandsNew CaledoniaNew ZealandNicaraguaNigerNigeriaNorth AmericaNorwayOECD membersOmanOther small statesPacific island small statesPakistanPalauPanamaPapua New GuineaParaguayPeruPhilippinesPolandPortugalPost-demographic dividendPre-demographic dividendPuerto RicoQatarRomaniaRussian FederationRwandaSao Tome and PrincipeSaudi ArabiaSenegalSerbiaSeychellesSierra LeoneSingaporeSlovak RepublicSloveniaSmall statesSolomon IslandsSomaliaSouth AfricaSouth AsiaSouth Asia (IDA & IBRD)SpainSri LankaSt. Kitts and NevisSt. LuciaSt. Vincent and the GrenadinesSub-Saharan Africa Sub-Saharan Africa (excluding high income)Sub-Saharan Africa (IDA & IBRD countries)SudanSurinameSwazilandSwedenSwitzerlandSyrian Arab RepublicTajikistanTanzaniaThailandTimor-LesteTogoTongaTrinidad and TobagoTunisiaTurkeyTurkmenistanTuvaluUgandaUkraineUnited KingdomUnited StatesUpper middle incomeUruguayUzbekistanVanuatuVenezuela, RBVietnamWest Bank and GazaWorldYemen, Rep.ZambiaZimbabwe Timeline:
This timeline shows a graph from 1961 to 2016 of Suriname. No data until 1960. Number of actual observations by date: 56.
Source name:
World Development Indicators
Source organization:
World Bank national accounts data, and OECD National Accounts data files.
Categories, topics:
Economy & Growth
Last updated:
apr 23, 2017
Indicators value changes by year
Minimum:
16.409
jan 1, 1994
Maximum:
54.285
jan 1, 1975
At the date of observation
Value
Absolute change
Change from previous value
jan 1, 1961
46.09
+46.09
0.0%
jan 1, 1962
43.375
-2.714
-5.89%
jan 1, 1963
41.725
-1.651
-3.81%
jan 1, 1964
41.362
-0.363
-0.87%
jan 1, 1965
41.613
+0.252
0.61%
jan 1, 1966
42.617
+1.004
2.41%
jan 1, 1967
49.435
+6.817
16.0%
jan 1, 1968
50.905
+1.47
2.97%
jan 1, 1969
50.937
+0.032
0.06%
jan 1, 1970
51.139
+0.203
0.4%
jan 1, 1971
47.1
-4.039
-7.9%
jan 1, 1972
48.921
+1.821
3.87%
jan 1, 1973
46.94
-1.981
-4.05%
jan 1, 1974
49.156
+2.216
4.72%
jan 1, 1975
54.285
+5.128
10.43%
jan 1, 1976
40.725
-13.56
-24.98%
jan 1, 1977
40.591
-0.133
-0.33%
jan 1, 1978
42.446
+1.855
4.57%
jan 1, 1979
39.607
-2.839
-6.69%
jan 1, 1980
39.509
-0.098
-0.25%
jan 1, 1981
38.864
-0.644
-1.63%
jan 1, 1982
38.117
-0.747
-1.92%
jan 1, 1983
33.97
-4.147
-10.88%
jan 1, 1984
31.386
-2.584
-7.61%
jan 1, 1985
32.004
+0.617
1.97%
jan 1, 1986
30.138
-1.866
-5.83%
jan 1, 1987
28.314
-1.824
-6.05%
jan 1, 1988
25.06
-3.253
-11.49%
jan 1, 1989
28.135
+3.074
12.27%
jan 1, 1990
27.446
-0.689
-2.45%
jan 1, 1991
24.203
-3.243
-11.81%
jan 1, 1992
18.247
-5.956
-24.61%
jan 1, 1993
16.958
-1.289
-7.07%
jan 1, 1994
16.409
-0.549
-3.24%
jan 1, 1995
28.45
+12.041
73.38%
jan 1, 1996
31.834
+3.384
11.89%
jan 1, 1997
28.941
-2.892
-9.09%
jan 1, 1998
29.023
+0.082
0.28%
jan 1, 1999
24.218
-4.806
-16.56%
jan 1, 2000
24.939
+0.722
2.98%
jan 1, 2001
25.163
+0.224
0.9%
jan 1, 2002
22.816
-2.347
-9.33%
jan 1, 2003
31.015
+8.199
35.94%
jan 1, 2004
30.822
-0.193
-0.62%
jan 1, 2005
35.275
+4.454
14.45%
jan 1, 2006
37.284
+2.008
5.69%
jan 1, 2007
40.213
+2.93
7.86%
jan 1, 2008
40.483
+0.27
0.67%
jan 1, 2009
43.183
+2.7
6.67%
jan 1, 2010
37.527
-5.656
-13.1%
jan 1, 2011
38.059
+0.532
1.42%
jan 1, 2012
38.833
+0.774
2.03%
jan 1, 2013
38.779
-0.054
-0.14%
jan 1, 2014
35.511
-3.268
-8.43%
jan 1, 2015
32.721
-2.789
-7.85%
jan 1, 2016
30.767
-1.954
-5.97%
Ranking of countries by current statistics by years


Comments: