29
/
en
AIzaSyAYiBZKx7MnpbEhh9jyipgxe19OcubqV5w
April 1, 2024
39091
IDA only
IDX
false
2
1
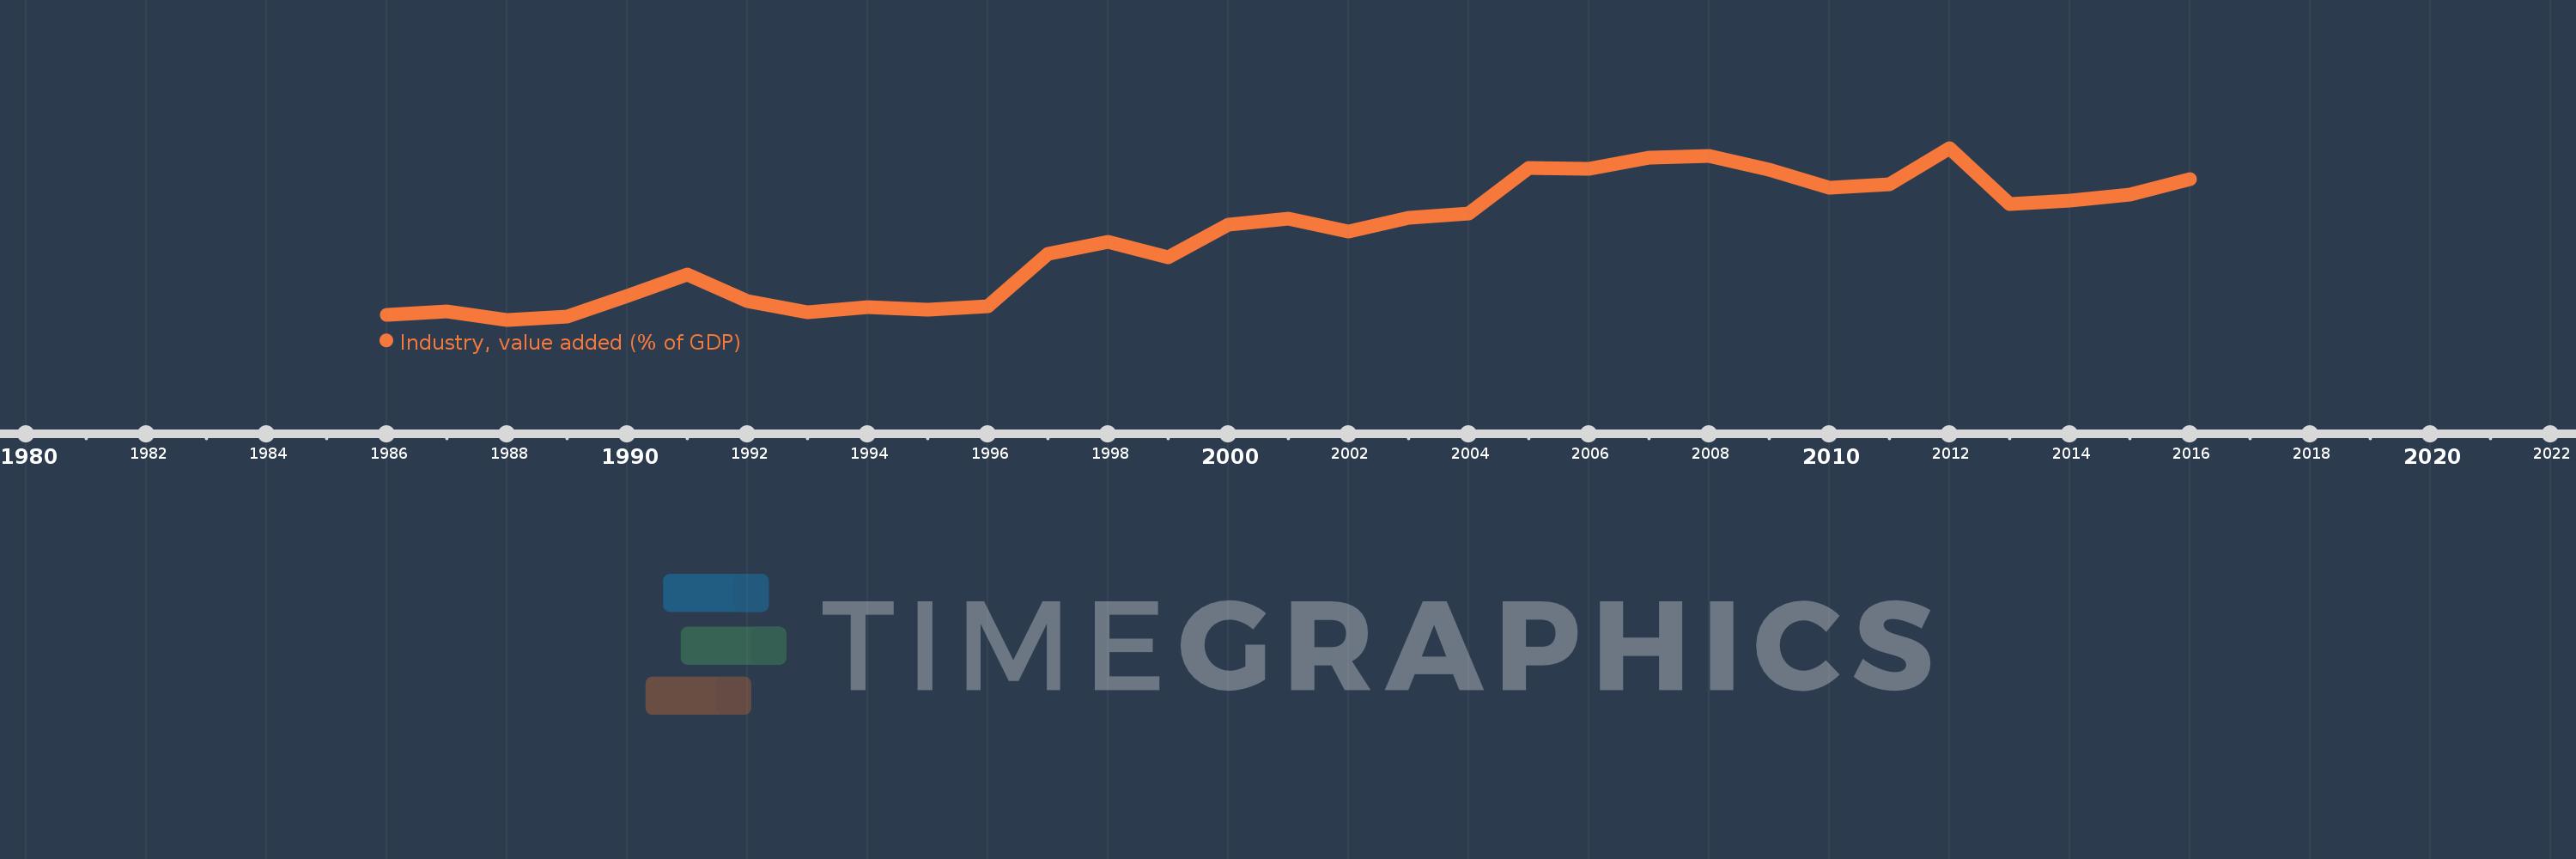
Industry, value added (% of GDP)
2016,2015,2014,2013,2012,2011,2010,2009,2008,2007,2006,2005,2004,2003,2002,2001,2000,1999,1998,1997,1996,1995,1994,1993,1992,1991,1990,1989,1988,1987,1986
This statistics in other country:
AfghanistanAlbaniaAlgeriaAndorraAngolaAntigua and BarbudaArab WorldArgentinaArmeniaArubaAustraliaAustriaAzerbaijanBahamas, TheBahrainBangladeshBarbadosBelarusBelgiumBelizeBeninBermudaBhutanBoliviaBosnia and HerzegovinaBotswanaBrazilBrunei DarussalamBulgariaBurkina FasoBurundiCabo VerdeCambodiaCameroonCanadaCaribbean small statesCayman IslandsCentral African RepublicCentral Europe and the BalticsChadChileChinaColombiaComorosCongo, Dem. Rep.Congo, Rep.Costa RicaCote d'IvoireCroatiaCubaCyprusCzech RepublicDenmarkDjiboutiDominicaDominican RepublicEarly-demographic dividendEast Asia & PacificEast Asia & Pacific (excluding high income)East Asia & Pacific (IDA & IBRD countries)EcuadorEgypt, Arab Rep.El SalvadorEquatorial GuineaEritreaEstoniaEthiopiaEuro areaEurope & Central AsiaEurope & Central Asia (excluding high income)Europe & Central Asia (IDA & IBRD countries)European UnionFijiFinlandFragile and conflict affected situationsFranceGabonGambia, TheGeorgiaGermanyGhanaGreeceGrenadaGuatemalaGuineaGuinea-BissauGuyanaHeavily indebted poor countries (HIPC)High incomeHondurasHong Kong SAR, ChinaHungaryIBRD onlyIcelandIDA & IBRD totalIDA blendIDA onlyIDA totalIndiaIndonesiaIran, Islamic Rep.IrelandItalyJamaicaJapanJordanKazakhstanKenyaKiribatiKorea, Rep.KosovoKuwaitKyrgyz RepublicLao PDRLate-demographic dividendLatin America & Caribbean Latin America & Caribbean (excluding high income)Latin America & the Caribbean (IDA & IBRD countries)LatviaLeast developed countries: UN classificationLebanonLesothoLibyaLiechtensteinLithuaniaLow & middle incomeLow incomeLower middle incomeLuxembourgMacao SAR, ChinaMacedonia, FYRMadagascarMalawiMalaysiaMaldivesMaliMaltaMarshall IslandsMauritaniaMauritiusMexicoMicronesia, Fed. Sts.Middle East & North AfricaMiddle East & North Africa (excluding high income)Middle East & North Africa (IDA & IBRD countries)Middle incomeMoldovaMongoliaMontenegroMoroccoMozambiqueMyanmarNamibiaNepalNetherlandsNew CaledoniaNew ZealandNicaraguaNigerNigeriaNorth AmericaNorwayOECD membersOmanOther small statesPacific island small statesPakistanPalauPanamaPapua New GuineaParaguayPeruPhilippinesPolandPortugalPost-demographic dividendPre-demographic dividendPuerto RicoQatarRomaniaRussian FederationRwandaSao Tome and PrincipeSaudi ArabiaSenegalSerbiaSeychellesSierra LeoneSingaporeSlovak RepublicSloveniaSmall statesSolomon IslandsSomaliaSouth AfricaSouth AsiaSouth Asia (IDA & IBRD)SpainSri LankaSt. Kitts and NevisSt. LuciaSt. Vincent and the GrenadinesSub-Saharan Africa Sub-Saharan Africa (excluding high income)Sub-Saharan Africa (IDA & IBRD countries)SudanSurinameSwazilandSwedenSwitzerlandSyrian Arab RepublicTajikistanTanzaniaThailandTimor-LesteTogoTongaTrinidad and TobagoTunisiaTurkeyTurkmenistanTuvaluUgandaUkraineUnited KingdomUnited StatesUpper middle incomeUruguayUzbekistanVanuatuVenezuela, RBVietnamWest Bank and GazaWorldYemen, Rep.ZambiaZimbabwe Timeline:
This timeline shows a graph from 1986 to 2016 of IDA only. No data until 1985. Number of actual observations by date: 31.
Source name:
World Development Indicators
Source organization:
World Bank national accounts data, and OECD National Accounts data files.
Categories, topics:
Economy & Growth
Last updated:
apr 23, 2017
Indicators value changes by year
Minimum:
19.884
jan 1, 1988
Maximum:
25.648
jan 1, 2012
At the date of observation
Value
Absolute change
Change from previous value
jan 1, 1986
20.043
+20.043
0.0%
jan 1, 1987
20.175
+0.132
0.66%
jan 1, 1988
19.884
-0.291
-1.44%
jan 1, 1989
19.978
+0.094
0.47%
jan 1, 1990
20.676
+0.698
3.49%
jan 1, 1991
21.411
+0.735
3.55%
jan 1, 1992
20.518
-0.893
-4.17%
jan 1, 1993
20.143
-0.375
-1.83%
jan 1, 1994
20.306
+0.163
0.81%
jan 1, 1995
20.211
-0.095
-0.47%
jan 1, 1996
20.33
+0.119
0.59%
jan 1, 1997
22.086
+1.756
8.64%
jan 1, 1998
22.496
+0.41
1.86%
jan 1, 1999
21.991
-0.505
-2.24%
jan 1, 2000
23.061
+1.069
4.86%
jan 1, 2001
23.267
+0.206
0.9%
jan 1, 2002
22.852
-0.415
-1.78%
jan 1, 2003
23.313
+0.461
2.02%
jan 1, 2004
23.457
+0.144
0.62%
jan 1, 2005
24.98
+1.523
6.49%
jan 1, 2006
24.938
-0.042
-0.17%
jan 1, 2007
25.313
+0.374
1.5%
jan 1, 2008
25.389
+0.076
0.3%
jan 1, 2009
24.921
-0.468
-1.84%
jan 1, 2010
24.314
-0.608
-2.44%
jan 1, 2011
24.426
+0.112
0.46%
jan 1, 2012
25.648
+1.222
5.0%
jan 1, 2013
23.774
-1.874
-7.31%
jan 1, 2014
23.875
+0.101
0.43%
jan 1, 2015
24.083
+0.208
0.87%
jan 1, 2016
24.615
+0.531
2.21%
Ranking of countries by current statistics by years


Comments: