29
/
en
AIzaSyAYiBZKx7MnpbEhh9jyipgxe19OcubqV5w
April 1, 2024
277815
Uruguay
URY
true
2
1
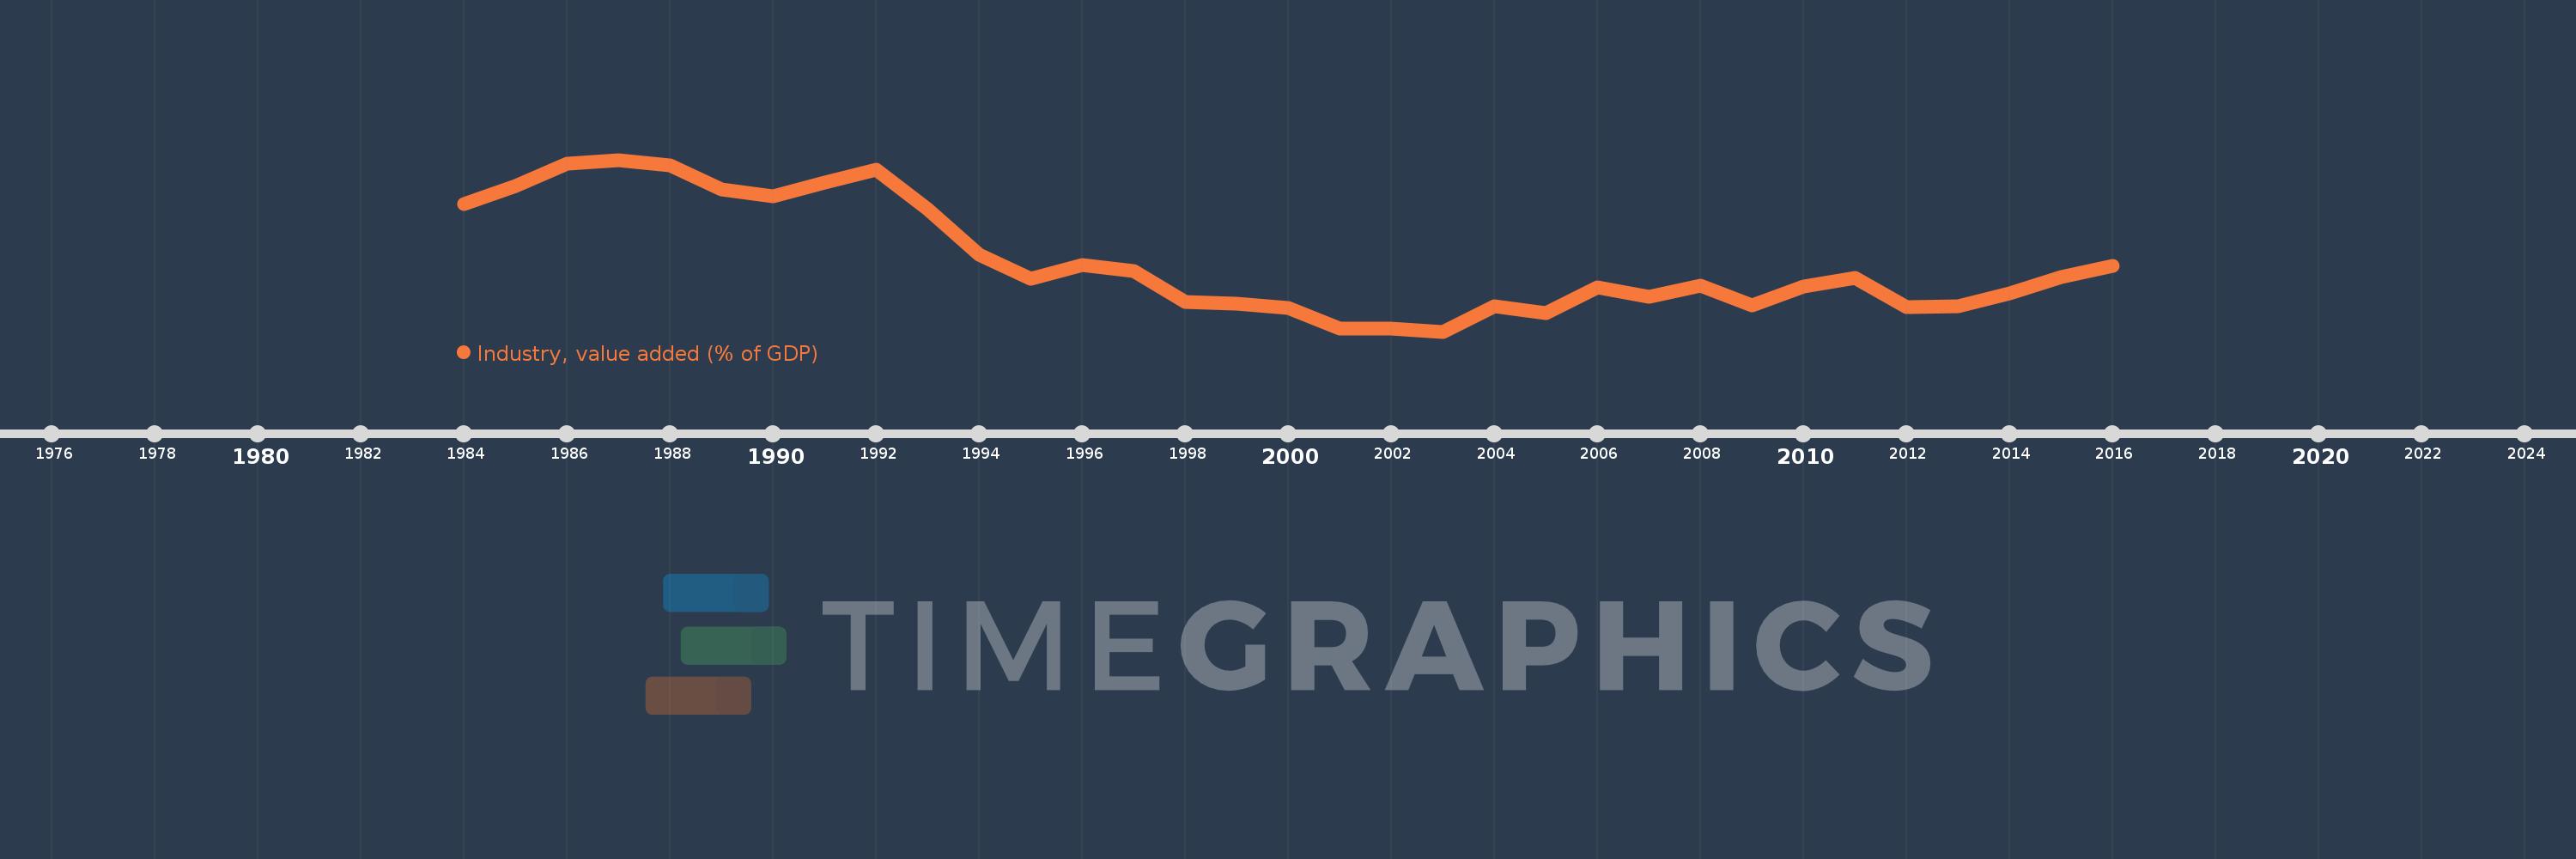
Industry, value added (% of GDP)
2016,2015,2014,2013,2012,2011,2010,2009,2008,2007,2006,2005,2004,2003,2002,2001,2000,1999,1998,1997,1996,1995,1994,1993,1992,1991,1990,1989,1988,1987,1986,1985,1984
This statistics in other country:
AfghanistanAlbaniaAlgeriaAndorraAngolaAntigua and BarbudaArab WorldArgentinaArmeniaArubaAustraliaAustriaAzerbaijanBahamas, TheBahrainBangladeshBarbadosBelarusBelgiumBelizeBeninBermudaBhutanBoliviaBosnia and HerzegovinaBotswanaBrazilBrunei DarussalamBulgariaBurkina FasoBurundiCabo VerdeCambodiaCameroonCanadaCaribbean small statesCayman IslandsCentral African RepublicCentral Europe and the BalticsChadChileChinaColombiaComorosCongo, Dem. Rep.Congo, Rep.Costa RicaCote d'IvoireCroatiaCubaCyprusCzech RepublicDenmarkDjiboutiDominicaDominican RepublicEarly-demographic dividendEast Asia & PacificEast Asia & Pacific (excluding high income)East Asia & Pacific (IDA & IBRD countries)EcuadorEgypt, Arab Rep.El SalvadorEquatorial GuineaEritreaEstoniaEthiopiaEuro areaEurope & Central AsiaEurope & Central Asia (excluding high income)Europe & Central Asia (IDA & IBRD countries)European UnionFijiFinlandFragile and conflict affected situationsFranceGabonGambia, TheGeorgiaGermanyGhanaGreeceGrenadaGuatemalaGuineaGuinea-BissauGuyanaHeavily indebted poor countries (HIPC)High incomeHondurasHong Kong SAR, ChinaHungaryIBRD onlyIcelandIDA & IBRD totalIDA blendIDA onlyIDA totalIndiaIndonesiaIran, Islamic Rep.IrelandItalyJamaicaJapanJordanKazakhstanKenyaKiribatiKorea, Rep.KosovoKuwaitKyrgyz RepublicLao PDRLate-demographic dividendLatin America & Caribbean Latin America & Caribbean (excluding high income)Latin America & the Caribbean (IDA & IBRD countries)LatviaLeast developed countries: UN classificationLebanonLesothoLibyaLiechtensteinLithuaniaLow & middle incomeLow incomeLower middle incomeLuxembourgMacao SAR, ChinaMacedonia, FYRMadagascarMalawiMalaysiaMaldivesMaliMaltaMarshall IslandsMauritaniaMauritiusMexicoMicronesia, Fed. Sts.Middle East & North AfricaMiddle East & North Africa (excluding high income)Middle East & North Africa (IDA & IBRD countries)Middle incomeMoldovaMongoliaMontenegroMoroccoMozambiqueMyanmarNamibiaNepalNetherlandsNew CaledoniaNew ZealandNicaraguaNigerNigeriaNorth AmericaNorwayOECD membersOmanOther small statesPacific island small statesPakistanPalauPanamaPapua New GuineaParaguayPeruPhilippinesPolandPortugalPost-demographic dividendPre-demographic dividendPuerto RicoQatarRomaniaRussian FederationRwandaSao Tome and PrincipeSaudi ArabiaSenegalSerbiaSeychellesSierra LeoneSingaporeSlovak RepublicSloveniaSmall statesSolomon IslandsSomaliaSouth AfricaSouth AsiaSouth Asia (IDA & IBRD)SpainSri LankaSt. Kitts and NevisSt. LuciaSt. Vincent and the GrenadinesSub-Saharan Africa Sub-Saharan Africa (excluding high income)Sub-Saharan Africa (IDA & IBRD countries)SudanSurinameSwazilandSwedenSwitzerlandSyrian Arab RepublicTajikistanTanzaniaThailandTimor-LesteTogoTongaTrinidad and TobagoTunisiaTurkeyTurkmenistanTuvaluUgandaUkraineUnited KingdomUnited StatesUpper middle incomeUruguayUzbekistanVanuatuVenezuela, RBVietnamWest Bank and GazaWorldYemen, Rep.ZambiaZimbabwe Timeline:
This timeline shows a graph from 1984 to 2016 of Uruguay. No data until 1983. Number of actual observations by date: 33.
Source name:
World Development Indicators
Source organization:
World Bank national accounts data, and OECD National Accounts data files.
Categories, topics:
Economy & Growth
Last updated:
apr 23, 2017
Indicators value changes by year
Minimum:
24.328
jan 1, 2003
Maximum:
36.226
jan 1, 1987
At the date of observation
Value
Absolute change
Change from previous value
jan 1, 1984
33.141
+33.141
0.0%
jan 1, 1985
34.412
+1.272
3.84%
jan 1, 1986
35.948
+1.535
4.46%
jan 1, 1987
36.226
+0.279
0.77%
jan 1, 1988
35.833
-0.393
-1.09%
jan 1, 1989
34.201
-1.632
-4.56%
jan 1, 1990
33.67
-0.53
-1.55%
jan 1, 1991
34.642
+0.972
2.89%
jan 1, 1992
35.549
+0.906
2.62%
jan 1, 1993
32.782
-2.766
-7.78%
jan 1, 1994
29.664
-3.118
-9.51%
jan 1, 1995
27.997
-1.668
-5.62%
jan 1, 1996
28.919
+0.922
3.29%
jan 1, 1997
28.545
-0.373
-1.29%
jan 1, 1998
26.374
-2.172
-7.61%
jan 1, 1999
26.245
-0.129
-0.49%
jan 1, 2000
25.955
-0.29
-1.1%
jan 1, 2001
24.507
-1.447
-5.58%
jan 1, 2002
24.531
+0.024
0.1%
jan 1, 2003
24.328
-0.203
-0.83%
jan 1, 2004
26.059
+1.731
7.12%
jan 1, 2005
25.612
-0.447
-1.72%
jan 1, 2006
27.417
+1.805
7.05%
jan 1, 2007
26.718
-0.699
-2.55%
jan 1, 2008
27.488
+0.77
2.88%
jan 1, 2009
26.167
-1.321
-4.8%
jan 1, 2010
27.425
+1.258
4.81%
jan 1, 2011
28.061
+0.636
2.32%
jan 1, 2012
26.016
-2.045
-7.29%
jan 1, 2013
26.104
+0.088
0.34%
jan 1, 2014
26.985
+0.881
3.37%
jan 1, 2015
28.118
+1.133
4.2%
jan 1, 2016
28.895
+0.777
2.76%
Ranking of countries by current statistics by years


Comments: