29
/
en
AIzaSyAYiBZKx7MnpbEhh9jyipgxe19OcubqV5w
April 1, 2024
239436
Sierra Leone
SLE
true
2
1
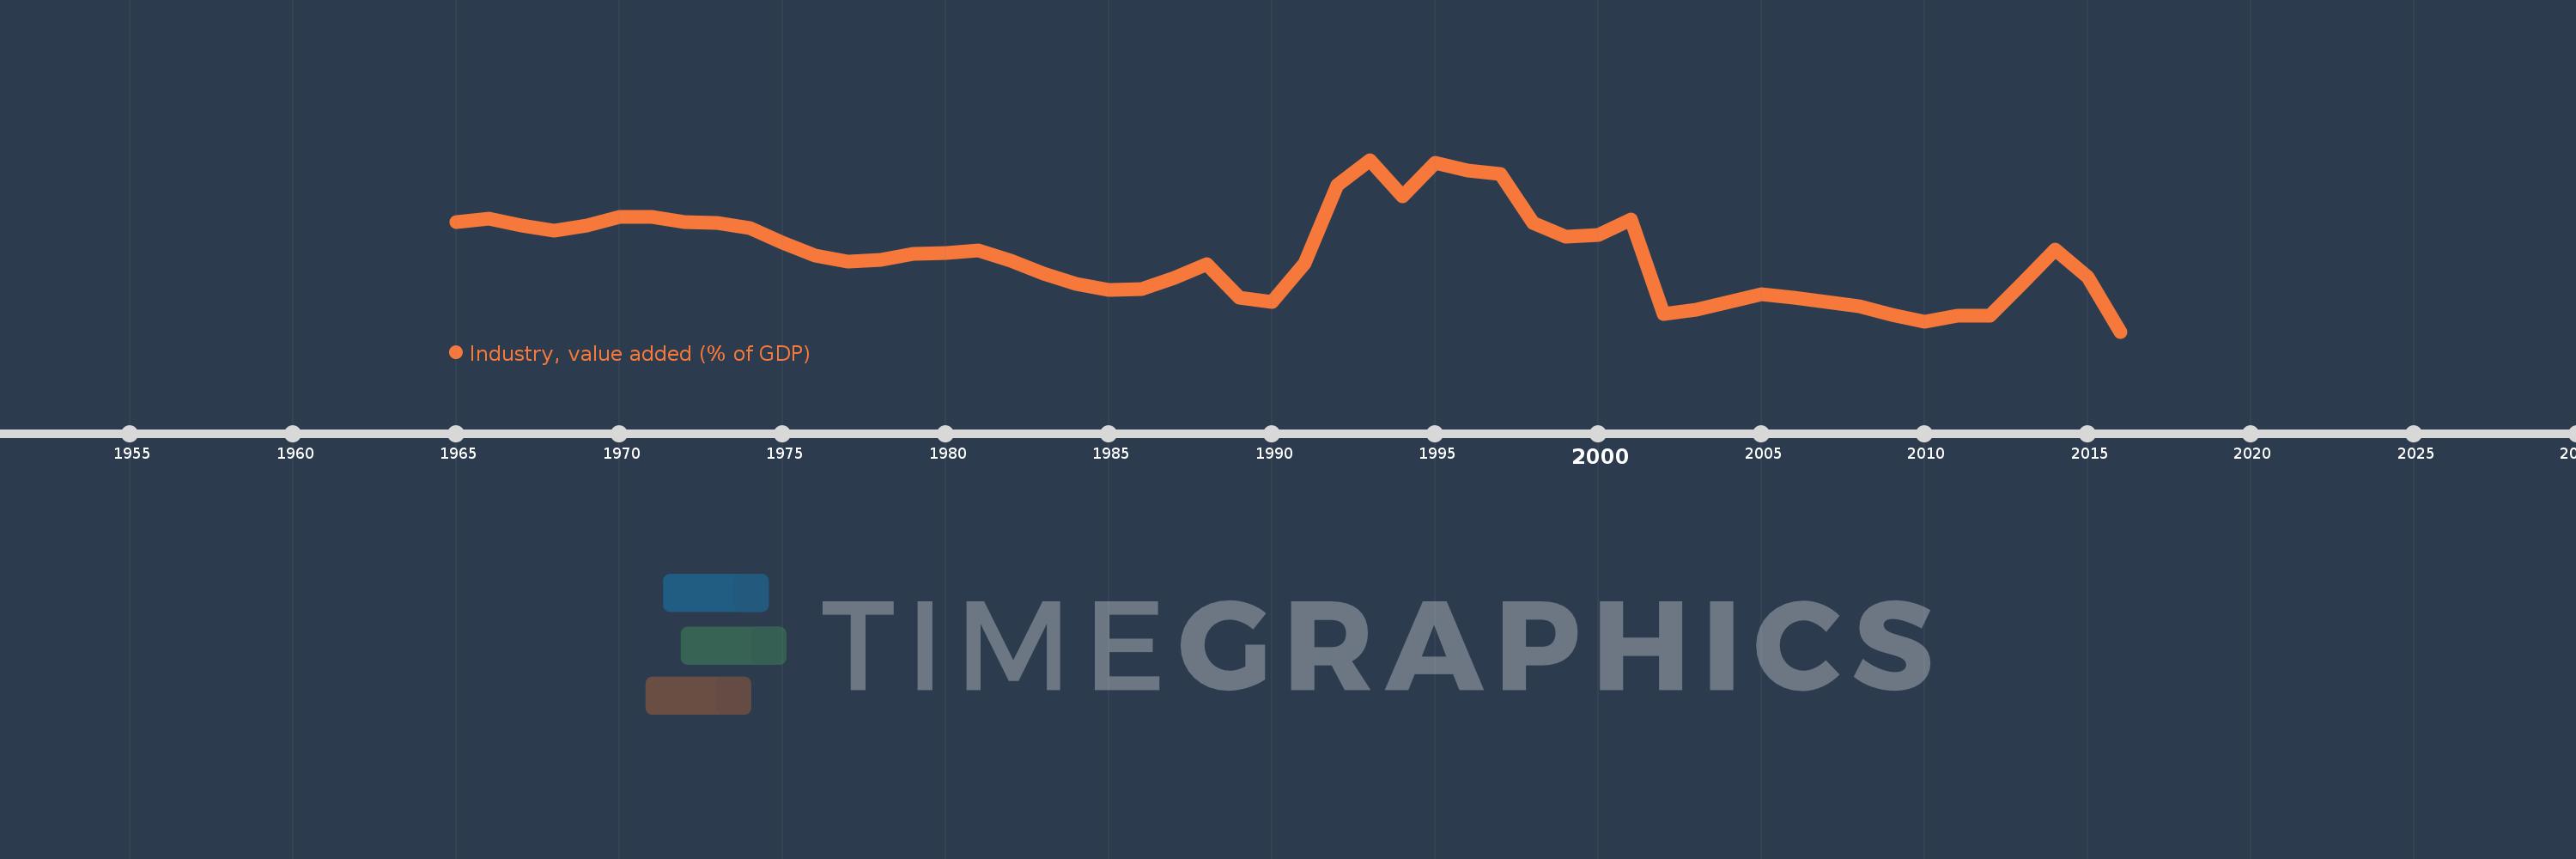
Industry, value added (% of GDP)
2016,2015,2014,2013,2012,2011,2010,2009,2008,2007,2006,2005,2004,2003,2002,2001,2000,1999,1998,1997,1996,1995,1994,1993,1992,1991,1990,1989,1988,1987,1986,1985,1984,1983,1982,1981,1980,1979,1978,1977,1976,1975,1974,1973,1972,1971,1970,1969,1968,1967,1966,1965
This statistics in other country:
AfghanistanAlbaniaAlgeriaAndorraAngolaAntigua and BarbudaArab WorldArgentinaArmeniaArubaAustraliaAustriaAzerbaijanBahamas, TheBahrainBangladeshBarbadosBelarusBelgiumBelizeBeninBermudaBhutanBoliviaBosnia and HerzegovinaBotswanaBrazilBrunei DarussalamBulgariaBurkina FasoBurundiCabo VerdeCambodiaCameroonCanadaCaribbean small statesCayman IslandsCentral African RepublicCentral Europe and the BalticsChadChileChinaColombiaComorosCongo, Dem. Rep.Congo, Rep.Costa RicaCote d'IvoireCroatiaCubaCyprusCzech RepublicDenmarkDjiboutiDominicaDominican RepublicEarly-demographic dividendEast Asia & PacificEast Asia & Pacific (excluding high income)East Asia & Pacific (IDA & IBRD countries)EcuadorEgypt, Arab Rep.El SalvadorEquatorial GuineaEritreaEstoniaEthiopiaEuro areaEurope & Central AsiaEurope & Central Asia (excluding high income)Europe & Central Asia (IDA & IBRD countries)European UnionFijiFinlandFragile and conflict affected situationsFranceGabonGambia, TheGeorgiaGermanyGhanaGreeceGrenadaGuatemalaGuineaGuinea-BissauGuyanaHeavily indebted poor countries (HIPC)High incomeHondurasHong Kong SAR, ChinaHungaryIBRD onlyIcelandIDA & IBRD totalIDA blendIDA onlyIDA totalIndiaIndonesiaIran, Islamic Rep.IrelandItalyJamaicaJapanJordanKazakhstanKenyaKiribatiKorea, Rep.KosovoKuwaitKyrgyz RepublicLao PDRLate-demographic dividendLatin America & Caribbean Latin America & Caribbean (excluding high income)Latin America & the Caribbean (IDA & IBRD countries)LatviaLeast developed countries: UN classificationLebanonLesothoLibyaLiechtensteinLithuaniaLow & middle incomeLow incomeLower middle incomeLuxembourgMacao SAR, ChinaMacedonia, FYRMadagascarMalawiMalaysiaMaldivesMaliMaltaMarshall IslandsMauritaniaMauritiusMexicoMicronesia, Fed. Sts.Middle East & North AfricaMiddle East & North Africa (excluding high income)Middle East & North Africa (IDA & IBRD countries)Middle incomeMoldovaMongoliaMontenegroMoroccoMozambiqueMyanmarNamibiaNepalNetherlandsNew CaledoniaNew ZealandNicaraguaNigerNigeriaNorth AmericaNorwayOECD membersOmanOther small statesPacific island small statesPakistanPalauPanamaPapua New GuineaParaguayPeruPhilippinesPolandPortugalPost-demographic dividendPre-demographic dividendPuerto RicoQatarRomaniaRussian FederationRwandaSao Tome and PrincipeSaudi ArabiaSenegalSerbiaSeychellesSierra LeoneSingaporeSlovak RepublicSloveniaSmall statesSolomon IslandsSomaliaSouth AfricaSouth AsiaSouth Asia (IDA & IBRD)SpainSri LankaSt. Kitts and NevisSt. LuciaSt. Vincent and the GrenadinesSub-Saharan Africa Sub-Saharan Africa (excluding high income)Sub-Saharan Africa (IDA & IBRD countries)SudanSurinameSwazilandSwedenSwitzerlandSyrian Arab RepublicTajikistanTanzaniaThailandTimor-LesteTogoTongaTrinidad and TobagoTunisiaTurkeyTurkmenistanTuvaluUgandaUkraineUnited KingdomUnited StatesUpper middle incomeUruguayUzbekistanVanuatuVenezuela, RBVietnamWest Bank and GazaWorldYemen, Rep.ZambiaZimbabwe Timeline:
This timeline shows a graph from 1965 to 2016 of Sierra Leone. No data until 1964. Number of actual observations by date: 52.
Source name:
World Development Indicators
Source organization:
World Bank national accounts data, and OECD National Accounts data files.
Categories, topics:
Economy & Growth
Last updated:
apr 23, 2017
Indicators value changes by year
Maximum:
41.015
jan 1, 1993
At the date of observation
Value
Absolute change
Change from previous value
jan 1, 1965
27.942
+27.942
0.0%
jan 1, 1966
28.518
+0.576
2.06%
jan 1, 1967
27.168
-1.351
-4.74%
jan 1, 1968
25.983
-1.184
-4.36%
jan 1, 1969
27.226
+1.242
4.78%
jan 1, 1970
29.026
+1.8
6.61%
jan 1, 1971
28.929
-0.097
-0.33%
jan 1, 1972
27.904
-1.025
-3.54%
jan 1, 1973
27.628
-0.276
-0.99%
jan 1, 1974
26.515
-1.113
-4.03%
jan 1, 1975
23.596
-2.918
-11.01%
jan 1, 1976
20.817
-2.779
-11.78%
jan 1, 1977
19.482
-1.335
-6.41%
jan 1, 1978
19.897
+0.414
2.13%
jan 1, 1979
21.252
+1.355
6.81%
jan 1, 1980
21.273
+0.021
0.1%
jan 1, 1981
21.929
+0.656
3.08%
jan 1, 1982
19.69
-2.24
-10.21%
jan 1, 1983
17.027
-2.663
-13.52%
jan 1, 1984
14.785
-2.242
-13.17%
jan 1, 1985
13.641
-1.144
-7.74%
jan 1, 1986
13.672
+0.031
0.23%
jan 1, 1987
16.039
+2.367
17.31%
jan 1, 1988
19.0
+2.961
18.46%
jan 1, 1989
12.0
-7.0
-36.84%
jan 1, 1990
11.0
-1.0
-8.33%
jan 1, 1991
19.158
+8.158
74.16%
jan 1, 1992
35.703
+16.545
86.36%
jan 1, 1993
41.015
+5.313
14.88%
jan 1, 1994
33.237
-7.779
-18.97%
jan 1, 1995
40.399
+7.162
21.55%
jan 1, 1996
38.718
-1.68
-4.16%
jan 1, 1997
38.114
-0.605
-1.56%
jan 1, 1998
27.686
-10.428
-27.36%
jan 1, 1999
24.712
-2.974
-10.74%
jan 1, 2000
25.159
+0.447
1.81%
jan 1, 2001
28.388
+3.229
12.83%
jan 1, 2002
8.536
-19.852
-69.93%
jan 1, 2003
9.455
+0.919
10.76%
jan 1, 2004
11.07
+1.615
17.08%
jan 1, 2005
12.589
+1.519
13.72%
jan 1, 2006
11.957
-0.632
-5.02%
jan 1, 2007
11.064
-0.893
-7.47%
jan 1, 2008
10.119
-0.945
-8.54%
jan 1, 2009
8.227
-1.892
-18.69%
jan 1, 2010
6.791
-1.436
-17.46%
jan 1, 2011
8.106
+1.315
19.37%
jan 1, 2012
8.176
+0.069
0.85%
jan 1, 2013
15.089
+6.914
84.57%
jan 1, 2014
21.996
+6.907
45.77%
jan 1, 2015
16.266
-5.73
-26.05%
jan 1, 2016
4.764
-11.502
-70.71%
Ranking of countries by current statistics by years


Comments: