29
/
en
AIzaSyAYiBZKx7MnpbEhh9jyipgxe19OcubqV5w
April 1, 2024
80131
Belarus
BLR
true
2
1
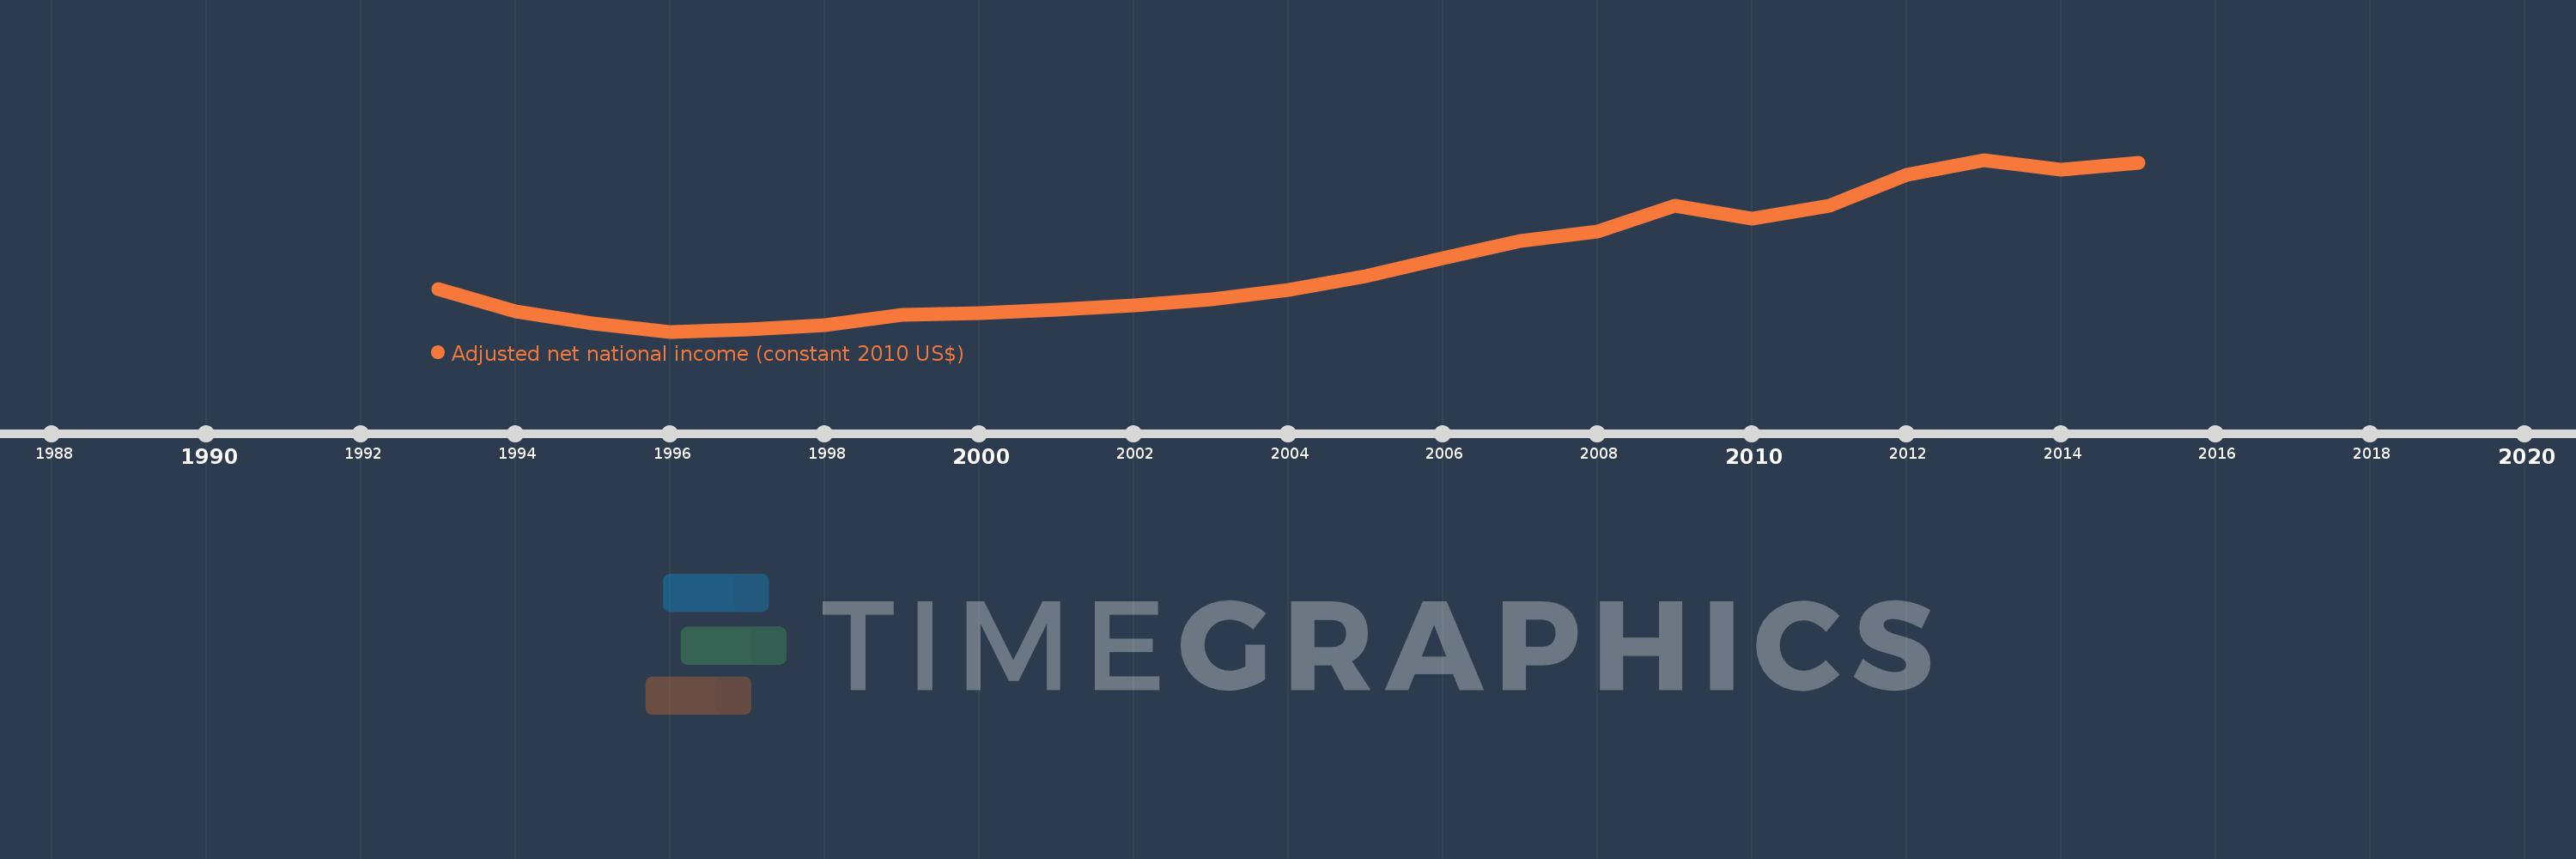
Adjusted net national income (constant 2010 US$)
2015,2014,2013,2012,2011,2010,2009,2008,2007,2006,2005,2004,2003,2002,2001,2000,1999,1998,1997,1996,1995,1994,1993
This statistics in other country:
AfghanistanAlbaniaAlgeriaAngolaArab WorldArgentinaArmeniaAustraliaAustriaAzerbaijanBahamas, TheBahrainBangladeshBarbadosBelarusBelgiumBelizeBeninBhutanBoliviaBotswanaBrazilBulgariaBurkina FasoBurundiCabo VerdeCambodiaCameroonCanadaCaribbean small statesCentral African RepublicCentral Europe and the BalticsChadChileChinaColombiaComorosCongo, Dem. Rep.Congo, Rep.Costa RicaCote d'IvoireCroatiaCubaCyprusCzech RepublicDenmarkDominicaDominican RepublicEarly-demographic dividendEast Asia & PacificEast Asia & Pacific (excluding high income)East Asia & Pacific (IDA & IBRD countries)EcuadorEgypt, Arab Rep.El SalvadorEritreaEstoniaEthiopiaEuro areaEurope & Central AsiaEurope & Central Asia (excluding high income)Europe & Central Asia (IDA & IBRD countries)European UnionFijiFinlandFragile and conflict affected situationsFranceGabonGambia, TheGeorgiaGermanyGhanaGreeceGuatemalaGuineaGuinea-BissauGuyanaHaitiHeavily indebted poor countries (HIPC)High incomeHondurasHungaryIBRD onlyIDA & IBRD totalIDA blendIDA onlyIDA totalIndiaIndonesiaIran, Islamic Rep.IraqIrelandIsraelItalyJamaicaJapanJordanKazakhstanKenyaKiribatiKorea, Rep.KuwaitKyrgyz RepublicLao PDRLate-demographic dividendLatin America & Caribbean Latin America & Caribbean (excluding high income)Latin America & the Caribbean (IDA & IBRD countries)LatviaLeast developed countries: UN classificationLebanonLesothoLiberiaLibyaLithuaniaLow & middle incomeLow incomeLower middle incomeLuxembourgMacedonia, FYRMadagascarMalawiMalaysiaMaldivesMaliMauritaniaMauritiusMexicoMiddle East & North AfricaMiddle East & North Africa (excluding high income)Middle East & North Africa (IDA & IBRD countries)Middle incomeMoldovaMongoliaMoroccoMozambiqueNamibiaNepalNetherlandsNew ZealandNicaraguaNigerNigeriaNorth AmericaNorwayOECD membersOmanOther small statesPacific island small statesPakistanPanamaPapua New GuineaParaguayPeruPhilippinesPolandPortugalPost-demographic dividendPre-demographic dividendQatarRomaniaRussian FederationRwandaSamoaSao Tome and PrincipeSaudi ArabiaSenegalSeychellesSierra LeoneSingaporeSlovak RepublicSloveniaSmall statesSolomon IslandsSouth AfricaSouth AsiaSouth Asia (IDA & IBRD)SpainSri LankaSt. LuciaSt. Vincent and the GrenadinesSub-Saharan Africa Sub-Saharan Africa (excluding high income)Sub-Saharan Africa (IDA & IBRD countries)SurinameSwazilandSwedenSwitzerlandTajikistanTanzaniaThailandTogoTongaTrinidad and TobagoTunisiaTurkeyTurkmenistanUgandaUkraineUnited Arab EmiratesUnited KingdomUnited StatesUpper middle incomeUruguayUzbekistanVanuatuVenezuela, RBVietnamWorldYemen, Rep.ZambiaZimbabwe Timeline:
This timeline shows a graph from 1993 to 2015 of Belarus. No data until 1992. Number of actual observations by date: 23.
Source name:
World Development Indicators
Source organization:
World Bank staff estimates based on sources and methods in World Bank's "The Changing Wealth of Nations: Measuring Sustainable Development in the New Millennium" (2011).
Categories, topics:
Economy & Growth
Last updated:
apr 23, 2017
Indicators value changes by year
Minimum:
14.03 bln
jan 1, 1996
Maximum:
60.699 bln
jan 1, 2013
At the date of observation
Value
Absolute change
Change from previous value
jan 1, 1993
25.615 bln
+25.615 bln
0.0%
jan 1, 1994
19.525 bln
-6.09 bln
-23.77%
jan 1, 1995
16.31 bln
-3.215 bln
-16.47%
jan 1, 1996
14.03 bln
-2.28 bln
-13.98%
jan 1, 1997
14.633 bln
+603.216 mln
4.3%
jan 1, 1998
15.857 bln
+1.224 bln
8.36%
jan 1, 1999
18.69 bln
+2.833 bln
17.87%
jan 1, 2000
19.018 bln
+328.121 mln
1.76%
jan 1, 2001
20.049 bln
+1.03 bln
5.42%
jan 1, 2002
21.154 bln
+1.105 bln
5.51%
jan 1, 2003
22.746 bln
+1.592 bln
7.53%
jan 1, 2004
25.426 bln
+2.681 bln
11.79%
jan 1, 2005
29.038 bln
+3.612 bln
14.2%
jan 1, 2006
34.088 bln
+5.05 bln
17.39%
jan 1, 2007
38.704 bln
+4.616 bln
13.54%
jan 1, 2008
41.255 bln
+2.551 bln
6.59%
jan 1, 2009
48.196 bln
+6.941 bln
16.82%
jan 1, 2010
44.614 bln
-3.582 bln
-7.43%
jan 1, 2011
48.256 bln
+3.642 bln
8.16%
jan 1, 2012
56.531 bln
+8.275 bln
17.15%
jan 1, 2013
60.699 bln
+4.169 bln
7.37%
jan 1, 2014
58.006 bln
-2.694 bln
-4.44%
jan 1, 2015
59.936 bln
+1.931 bln
3.33%
Ranking of countries by current statistics by years


Comments: