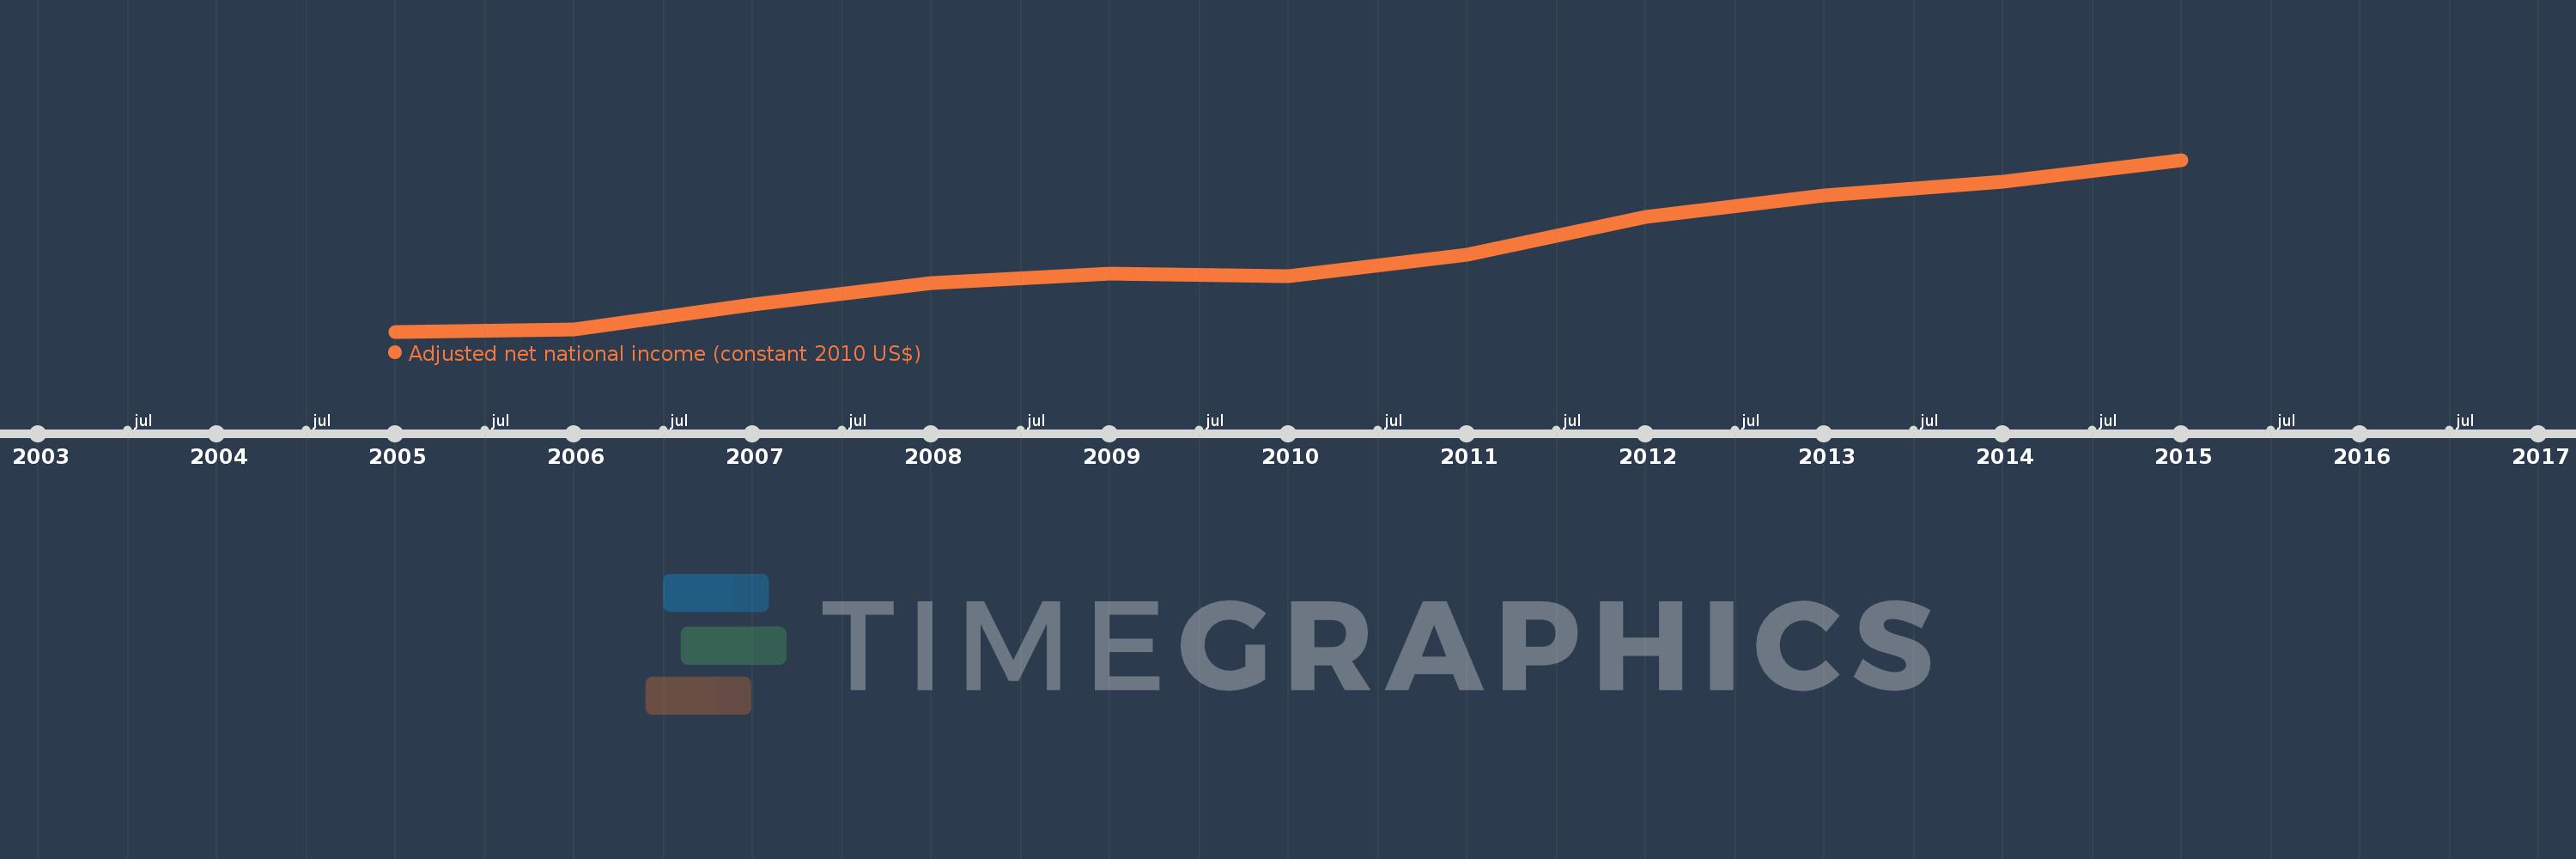
This timeline shows a graph from 2005 to 2015 of Small states. No data until 2004. Number of actual observations by date: 11.
Source name:
World Development Indicators
Source organization:
World Bank staff estimates based on sources and methods in World Bank's "The Changing Wealth of Nations: Measuring Sustainable Development in the New Millennium" (2011).
Categories, topics:
Economy & Growth
Last updated:
apr 23, 2017
Indicators value changes by year
Meaning:
248.935 bln
Minimum:
168.111 bln
jan 1, 2005
Maximum:
349.813 bln
jan 1, 2015
At the date of observation
Value
Absolute change
Change from the previous value
jan 1, 2005
168.111 bln
+168.111 bln
0.0%
jan 1, 2006
170.093 bln
+1.982 bln
1.18%
jan 1, 2007
196.796 bln
+26.703 bln
15.7%
jan 1, 2008
219.868 bln
+23.073 bln
11.72%
jan 1, 2009
229.231 bln
+9.362 bln
4.26%
jan 1, 2010
226.291 bln
-2.939 bln
-1.28%
jan 1, 2011
249.64 bln
+23.348 bln
10.32%
jan 1, 2012
289.699 bln
+40.06 bln
16.05%
jan 1, 2013
312.391 bln
+22.692 bln
7.83%
jan 1, 2014
326.352 bln
+13.961 bln
4.47%
jan 1, 2015
349.813 bln
+23.461 bln
7.19%
Ranking of countries by current statistics by years
