29
/
en
AIzaSyAYiBZKx7MnpbEhh9jyipgxe19OcubqV5w
April 1, 2024
183465
Macedonia, FYR
MKD
true
2
1
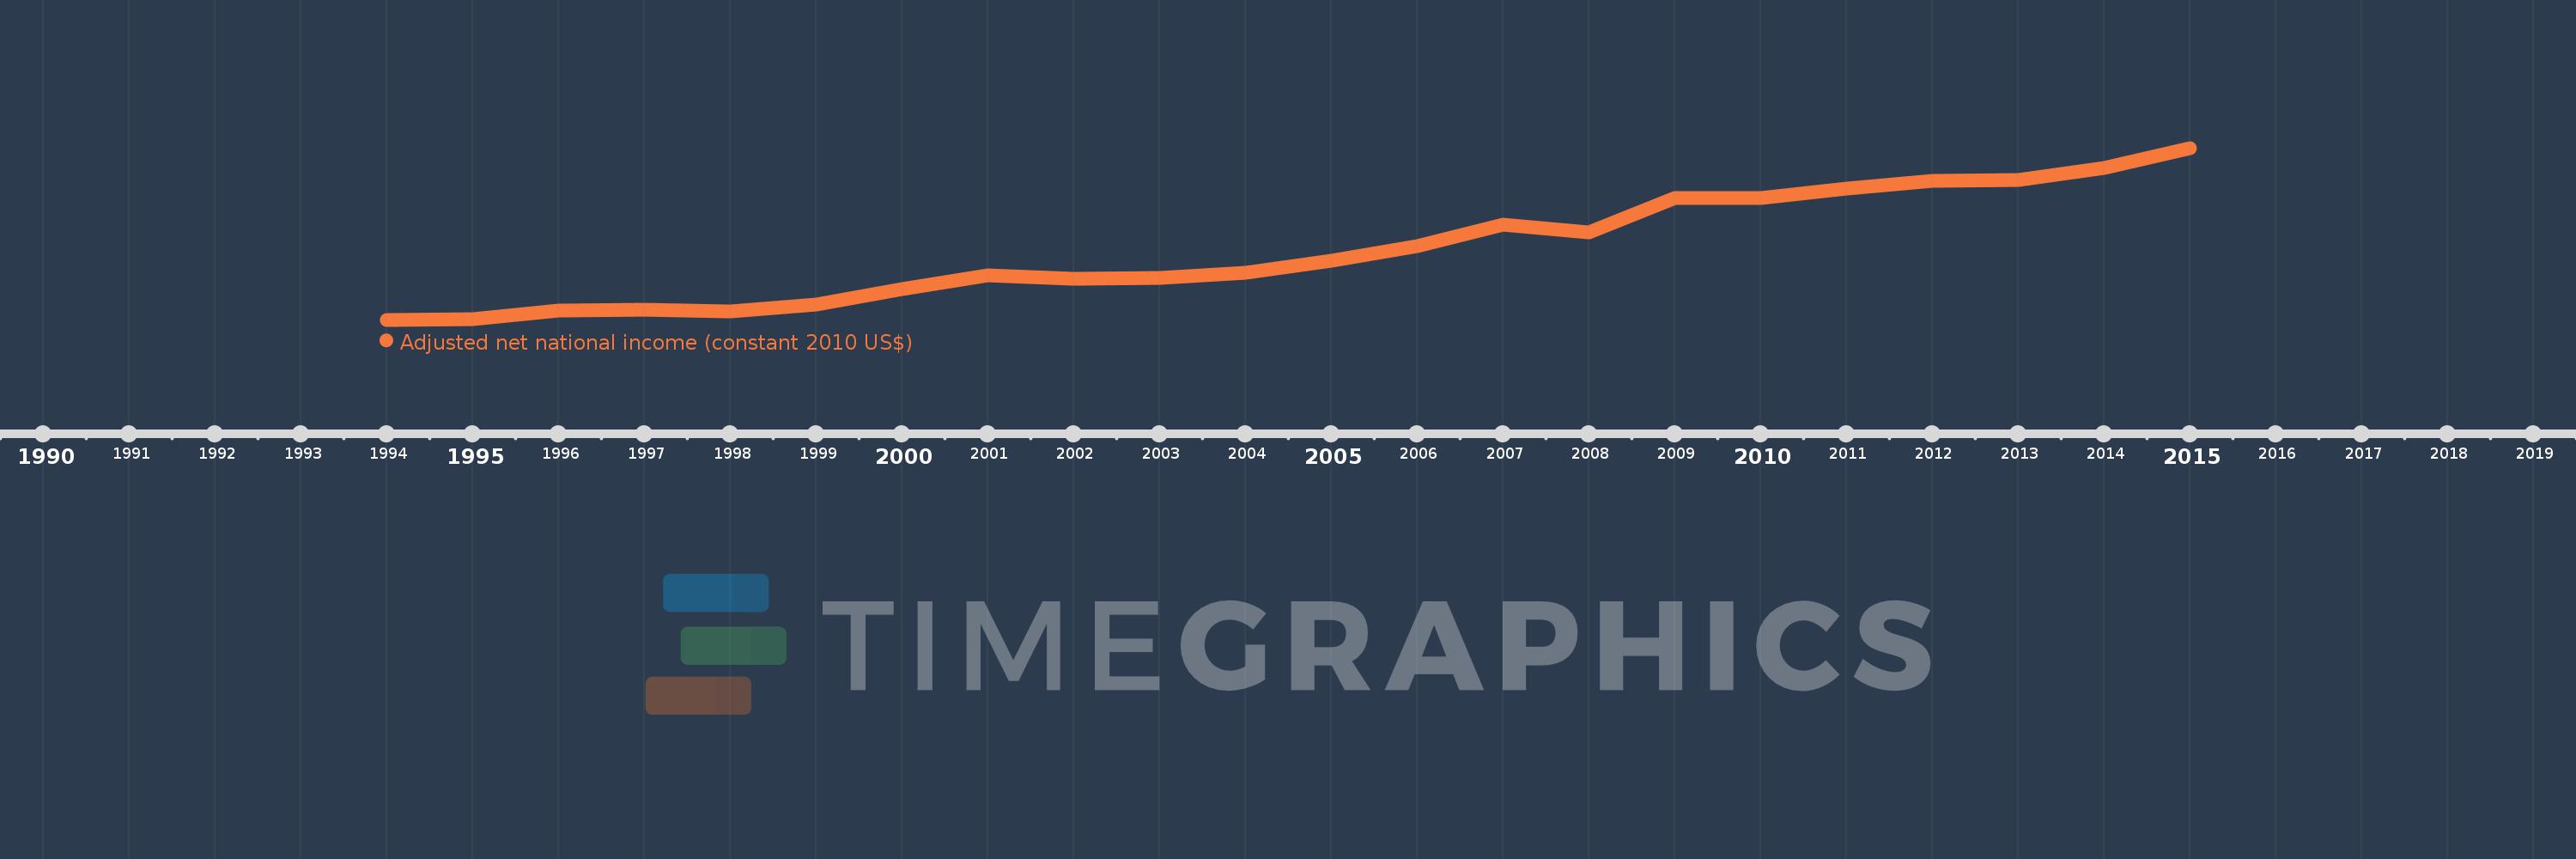
Adjusted net national income (constant 2010 US$)
2015,2014,2013,2012,2011,2010,2009,2008,2007,2006,2005,2004,2003,2002,2001,2000,1999,1998,1997,1996,1995,1994
This statistics in other country:
AfghanistanAlbaniaAlgeriaAngolaArab WorldArgentinaArmeniaAustraliaAustriaAzerbaijanBahamas, TheBahrainBangladeshBarbadosBelarusBelgiumBelizeBeninBhutanBoliviaBotswanaBrazilBulgariaBurkina FasoBurundiCabo VerdeCambodiaCameroonCanadaCaribbean small statesCentral African RepublicCentral Europe and the BalticsChadChileChinaColombiaComorosCongo, Dem. Rep.Congo, Rep.Costa RicaCote d'IvoireCroatiaCubaCyprusCzech RepublicDenmarkDominicaDominican RepublicEarly-demographic dividendEast Asia & PacificEast Asia & Pacific (excluding high income)East Asia & Pacific (IDA & IBRD countries)EcuadorEgypt, Arab Rep.El SalvadorEritreaEstoniaEthiopiaEuro areaEurope & Central AsiaEurope & Central Asia (excluding high income)Europe & Central Asia (IDA & IBRD countries)European UnionFijiFinlandFragile and conflict affected situationsFranceGabonGambia, TheGeorgiaGermanyGhanaGreeceGuatemalaGuineaGuinea-BissauGuyanaHaitiHeavily indebted poor countries (HIPC)High incomeHondurasHungaryIBRD onlyIDA & IBRD totalIDA blendIDA onlyIDA totalIndiaIndonesiaIran, Islamic Rep.IraqIrelandIsraelItalyJamaicaJapanJordanKazakhstanKenyaKiribatiKorea, Rep.KuwaitKyrgyz RepublicLao PDRLate-demographic dividendLatin America & Caribbean Latin America & Caribbean (excluding high income)Latin America & the Caribbean (IDA & IBRD countries)LatviaLeast developed countries: UN classificationLebanonLesothoLiberiaLibyaLithuaniaLow & middle incomeLow incomeLower middle incomeLuxembourgMacedonia, FYRMadagascarMalawiMalaysiaMaldivesMaliMauritaniaMauritiusMexicoMiddle East & North AfricaMiddle East & North Africa (excluding high income)Middle East & North Africa (IDA & IBRD countries)Middle incomeMoldovaMongoliaMoroccoMozambiqueNamibiaNepalNetherlandsNew ZealandNicaraguaNigerNigeriaNorth AmericaNorwayOECD membersOmanOther small statesPacific island small statesPakistanPanamaPapua New GuineaParaguayPeruPhilippinesPolandPortugalPost-demographic dividendPre-demographic dividendQatarRomaniaRussian FederationRwandaSamoaSao Tome and PrincipeSaudi ArabiaSenegalSeychellesSierra LeoneSingaporeSlovak RepublicSloveniaSmall statesSolomon IslandsSouth AfricaSouth AsiaSouth Asia (IDA & IBRD)SpainSri LankaSt. LuciaSt. Vincent and the GrenadinesSub-Saharan Africa Sub-Saharan Africa (excluding high income)Sub-Saharan Africa (IDA & IBRD countries)SurinameSwazilandSwedenSwitzerlandTajikistanTanzaniaThailandTogoTongaTrinidad and TobagoTunisiaTurkeyTurkmenistanUgandaUkraineUnited Arab EmiratesUnited KingdomUnited StatesUpper middle incomeUruguayUzbekistanVanuatuVenezuela, RBVietnamWorldYemen, Rep.ZambiaZimbabwe Timeline:
This timeline shows a graph from 1994 to 2015 of Macedonia, FYR. No data until 1993. Number of actual observations by date: 22.
Source name:
World Development Indicators
Source organization:
World Bank staff estimates based on sources and methods in World Bank's "The Changing Wealth of Nations: Measuring Sustainable Development in the New Millennium" (2011).
Categories, topics:
Economy & Growth
Last updated:
apr 23, 2017
Indicators value changes by year
Minimum:
4.753 bln
jan 1, 1994
Maximum:
8.247 bln
jan 1, 2015
At the date of observation
Value
Absolute change
Change from previous value
jan 1, 1994
4.753 bln
+4.753 bln
0.0%
jan 1, 1995
4.773 bln
+20.046 mln
0.42%
jan 1, 1996
4.944 bln
+170.71 mln
3.58%
jan 1, 1997
4.961 bln
+17.335 mln
0.35%
jan 1, 1998
4.919 bln
-41.977 mln
-0.85%
jan 1, 1999
5.062 bln
+143.102 mln
2.91%
jan 1, 2000
5.375 bln
+313.431 mln
6.19%
jan 1, 2001
5.662 bln
+286.846 mln
5.34%
jan 1, 2002
5.585 bln
-77.71 mln
-1.37%
jan 1, 2003
5.606 bln
+21.226 mln
0.38%
jan 1, 2004
5.705 bln
+99.144 mln
1.77%
jan 1, 2005
5.945 bln
+240.458 mln
4.21%
jan 1, 2006
6.255 bln
+309.888 mln
5.21%
jan 1, 2007
6.679 bln
+423.58 mln
6.77%
jan 1, 2008
6.524 bln
-154.781 mln
-2.32%
jan 1, 2009
7.233 bln
+709.265 mln
10.87%
jan 1, 2010
7.234 bln
+402.771K
0.01%
jan 1, 2011
7.428 bln
+193.8 mln
2.68%
jan 1, 2012
7.582 bln
+154.659 mln
2.08%
jan 1, 2013
7.602 bln
+19.477 mln
0.26%
jan 1, 2014
7.848 bln
+246.02 mln
3.24%
jan 1, 2015
8.247 bln
+399.514 mln
5.09%
Ranking of countries by current statistics by years


Comments: