30
/
AIzaSyAYiBZKx7MnpbEhh9jyipgxe19OcubqV5w
April 1, 2024
156919
Iran, Islamic Rep.
IRN
true
2
1
Adjusted net national income (constant 2010 US$)
2014,2013,2012,2011,2010,2009,2008,2007,2006,2005,2004,2003,2002,2001,2000,1999,1998,1997,1996,1995,1994
Download
Global statistics library →Iran, Islamic Rep. →

Adjusted net national income (constant 2010 US$)

This statistics in other country:

AfghanistanAlbaniaAlgeriaAngolaArab WorldArgentinaArmeniaAustraliaAustriaAzerbaijanBahamas, TheBahrainBangladeshBarbadosBelarusBelgiumBelizeBeninBhutanBoliviaBotswanaBrazilBulgariaBurkina FasoBurundiCabo VerdeCambodiaCameroonCanadaCaribbean small statesCentral African RepublicCentral Europe and the BalticsChadChileChinaColombiaComorosCongo, Dem. Rep.Congo, Rep.Costa RicaCote d'IvoireCroatiaCubaCyprusCzech RepublicDenmarkDominicaDominican RepublicEarly-demographic dividendEast Asia & PacificEast Asia & Pacific (excluding high income)East Asia & Pacific (IDA & IBRD countries)EcuadorEgypt, Arab Rep.El SalvadorEritreaEstoniaEthiopiaEuro areaEurope & Central AsiaEurope & Central Asia (excluding high income)Europe & Central Asia (IDA & IBRD countries)European UnionFijiFinlandFragile and conflict affected situationsFranceGabonGambia, TheGeorgiaGermanyGhanaGreeceGuatemalaGuineaGuinea-BissauGuyanaHaitiHeavily indebted poor countries (HIPC)High incomeHondurasHungaryIBRD onlyIDA & IBRD totalIDA blendIDA onlyIDA totalIndiaIndonesiaIran, Islamic Rep.IraqIrelandIsraelItalyJamaicaJapanJordanKazakhstanKenyaKiribatiKorea, Rep.KuwaitKyrgyz RepublicLao PDRLate-demographic dividendLatin America & Caribbean Latin America & Caribbean (excluding high income)Latin America & the Caribbean (IDA & IBRD countries)LatviaLeast developed countries: UN classificationLebanonLesothoLiberiaLibyaLithuaniaLow & middle incomeLow incomeLower middle incomeLuxembourgMacedonia, FYRMadagascarMalawiMalaysiaMaldivesMaliMauritaniaMauritiusMexicoMiddle East & North AfricaMiddle East & North Africa (excluding high income)Middle East & North Africa (IDA & IBRD countries)Middle incomeMoldovaMongoliaMoroccoMozambiqueNamibiaNepalNetherlandsNew ZealandNicaraguaNigerNigeriaNorth AmericaNorwayOECD membersOmanOther small statesPacific island small statesPakistanPanamaPapua New GuineaParaguayPeruPhilippinesPolandPortugalPost-demographic dividendPre-demographic dividendQatarRomaniaRussian FederationRwandaSamoaSao Tome and PrincipeSaudi ArabiaSenegalSeychellesSierra LeoneSingaporeSlovak RepublicSloveniaSmall statesSolomon IslandsSouth AfricaSouth AsiaSouth Asia (IDA & IBRD)SpainSri LankaSt. LuciaSt. Vincent and the GrenadinesSub-Saharan Africa Sub-Saharan Africa (excluding high income)Sub-Saharan Africa (IDA & IBRD countries)SurinameSwazilandSwedenSwitzerlandTajikistanTanzaniaThailandTogoTongaTrinidad and TobagoTunisiaTurkeyTurkmenistanUgandaUkraineUnited Arab EmiratesUnited KingdomUnited StatesUpper middle incomeUruguayUzbekistanVanuatuVenezuela, RBVietnamWorldYemen, Rep.ZambiaZimbabwe

Timeline:

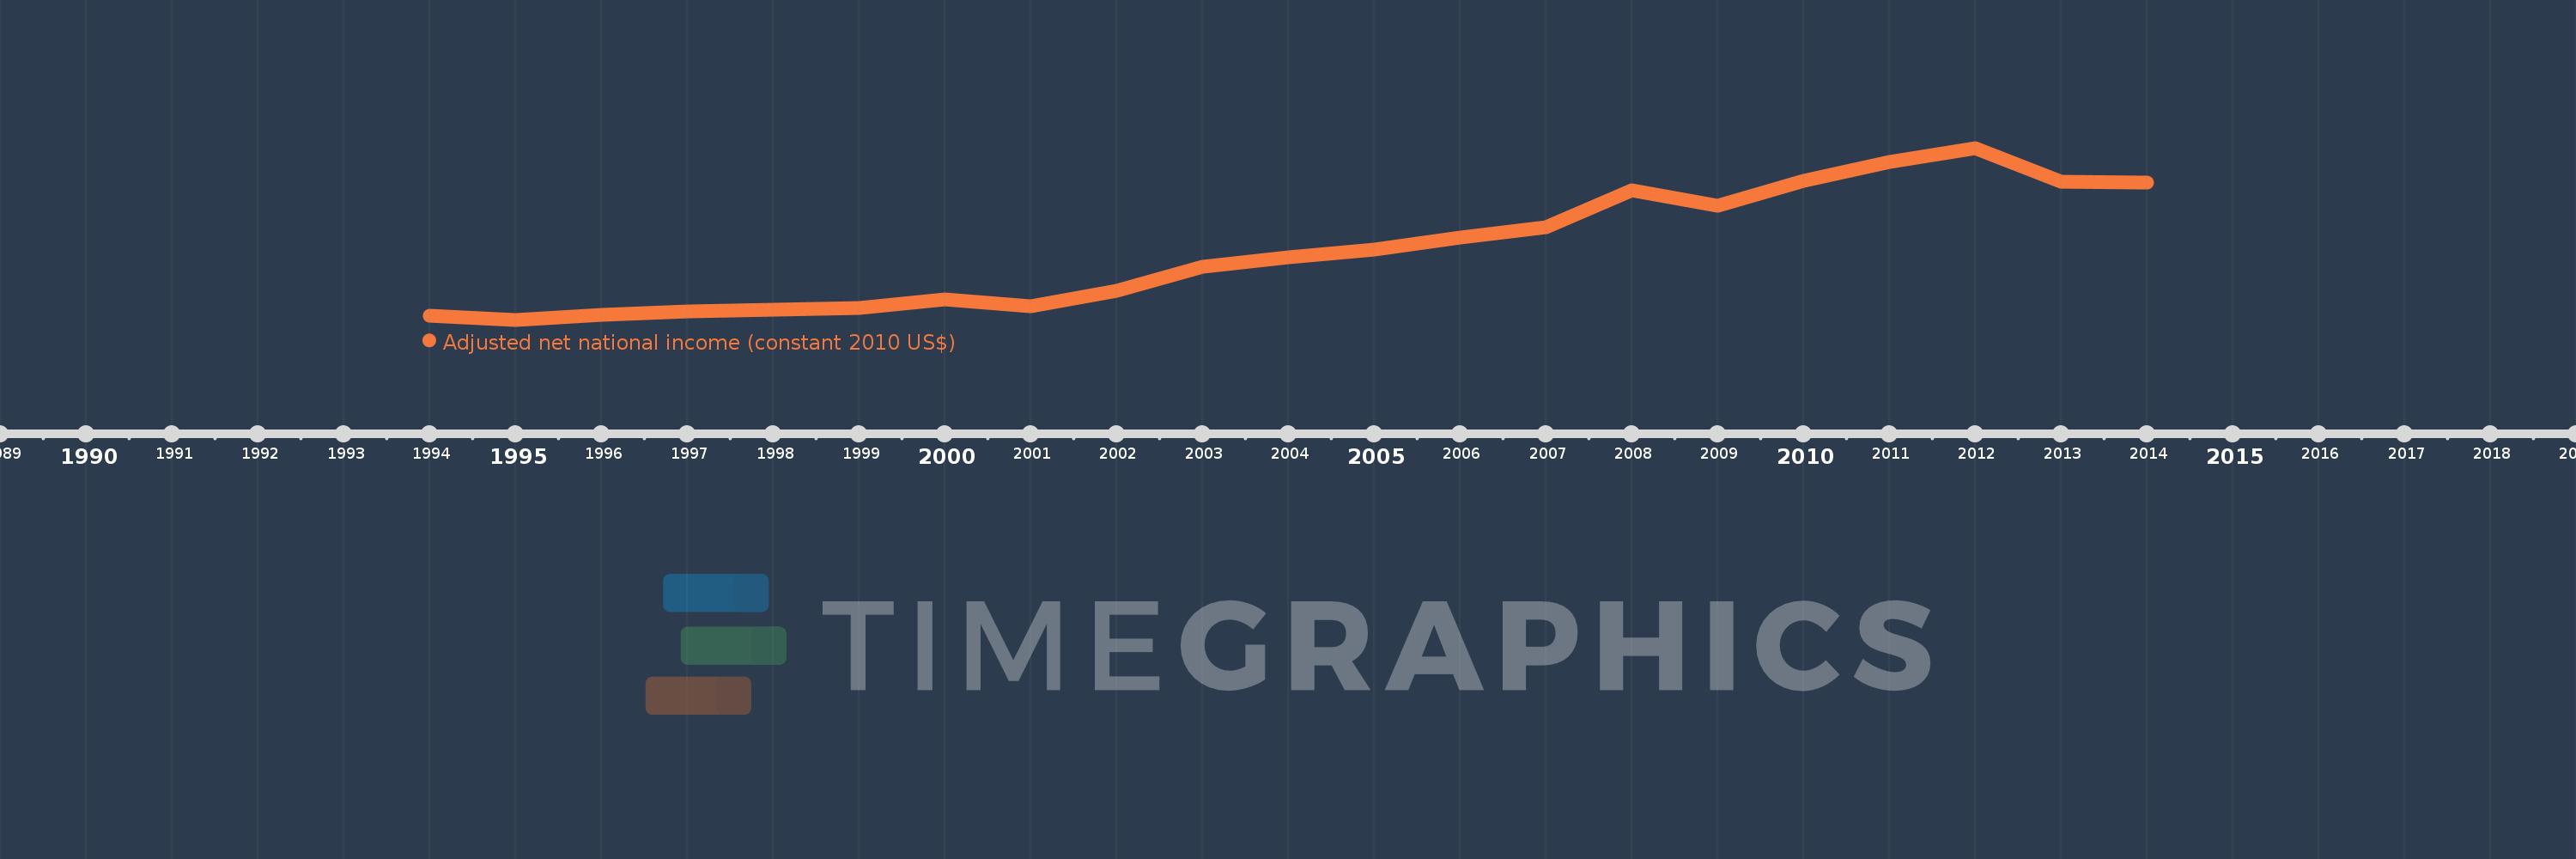
This timeline shows a graph from 1994 to 2014 of Iran, Islamic Rep.. No data until 1993. Number of actual observations by date: 21.

Source name:

World Development Indicators

Source organization:

World Bank staff estimates based on sources and methods in World Bank's "The Changing Wealth of Nations: Measuring Sustainable Development in the New Millennium" (2011).

Categories, topics:

Economy & Growth

Last updated:

apr 23, 2017

Indicators value changes by year

Meaning:
241.373 bln
Minimum:
148.291 bln
jan 1, 1995
Maximum:
380.019 bln
jan 1, 2012
At the date of observation
Value
Absolute change
Change from the previous value
jan 1, 1994
153.426 bln
+153.426 bln
0.0%
jan 1, 1995
148.291 bln
-5.135 bln
-3.35%
jan 1, 1996
154.338 bln
+6.047 bln
4.08%
jan 1, 1997
159.61 bln
+5.272 bln
3.42%
jan 1, 1998
161.295 bln
+1.685 bln
1.06%
jan 1, 1999
163.841 bln
+2.545 bln
1.58%
jan 1, 2000
175.359 bln
+11.519 bln
7.03%
jan 1, 2001
166.974 bln
-8.385 bln
-4.78%
jan 1, 2002
187.319 bln
+20.345 bln
12.18%
jan 1, 2003
219.969 bln
+32.65 bln
17.43%
jan 1, 2004
231.993 bln
+12.024 bln
5.47%
jan 1, 2005
243.354 bln
+11.36 bln
4.9%
jan 1, 2006
258.957 bln
+15.604 bln
6.41%
jan 1, 2007
273.242 bln
+14.285 bln
5.52%
jan 1, 2008
323.208 bln
+49.966 bln
18.29%
jan 1, 2009
302.368 bln
-20.84 bln
-6.45%
jan 1, 2010
335.448 bln
+33.08 bln
10.94%
jan 1, 2011
361.053 bln
+25.605 bln
7.63%
jan 1, 2012
380.019 bln
+18.966 bln
5.25%
jan 1, 2013
334.999 bln
-45.02 bln
-11.85%
jan 1, 2014
333.762 bln
-1.237 bln
-0.37%

Ranking of countries by current statistics by years